TESLA Stock - TSLA Pressure Building Up..
Summary
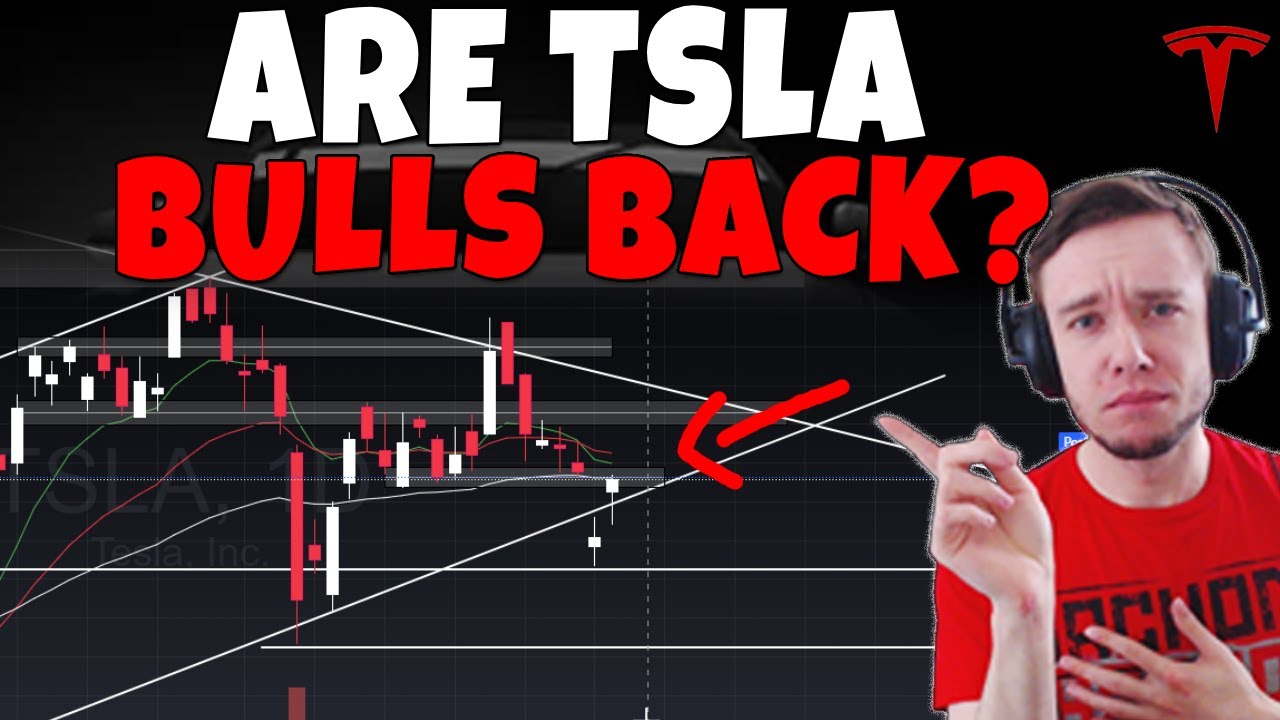
TLDRIn this Tesla stock update, the presenter discusses the recent performance of Tesla’s stock, touching on technical analysis and the potential future price movements. The key focus is on the stock’s reaction to Fibonacci levels and patterns like bull flags. The presenter highlights short-term resistance levels around the $328-$330 range and potential support at $320-$323. With the stock in a large daily pennant, there’s anticipation of either a breakout or breakdown, potentially moving the stock by $60 either way. The presenter also discusses options flow, indicating a mixed sentiment among traders. The video ends with advice on staying prepared for potential market shifts.
Takeaways
- 😀 Tesla stock is currently showing some positive movement, closing at around the mid-to-high 320s with a 3.5% increase on the day.
- 📊 The analysis focuses on short-term movements, with potential rejection points at the Fibonacci levels, particularly around 328-330.
- 📉 The market could face a short-term pullback if Tesla struggles around the current resistance zone, potentially dropping to the low 320s or even down to 320 itself.
- 🔮 The possibility of a bull flag formation is present, but it will depend on whether Tesla finds support at key levels or falls further.
- 🚨 If Tesla breaks below 313, there’s a potential for a move towards the bottom of the large daily pennant, which could lead to a drop closer to 300.
- 📈 A breakout above 340 could trigger a strong bullish move, potentially reaching up to $400, with a $60 move expected.
- 💡 Conversely, a drop below the low 300s might lead to a significant bearish movement, with a $60 move potentially pushing the stock towards the 240s-250s range.
- ⚖️ The current situation within the large daily pennant indicates that the stock may experience more volatility or choppy movement before making a clear direction.
- 💥 The MACD indicator is extremely flat, suggesting that significant pressure is building, and a quick and aggressive move could occur once the breakout or breakdown happens.
- 📅 Option flow shows mixed sentiment, with a shift from bullish to bearish throughout the day, signaling potential caution in the market for Tesla's short-term future.
Q & A
What is the main focus of this Tesla stock update?
-The main focus of the video is analyzing the current state of Tesla stock, including its recent performance, technical analysis, and potential price movements based on market patterns and Fibonacci levels.
What does the creator mention about the accuracy of their predictions?
-The creator acknowledges that their predictions are not always perfect, mentioning that the stock did not drop as much as they initially expected, but they still share their analysis based on market conditions.
What is a 'bull flag' and how does it relate to Tesla stock?
-A 'bull flag' is a technical chart pattern that suggests a continuation of an upward trend. The creator mentions that Tesla's stock price formed a bull flag pattern, which is a key factor in their analysis of short-term price movements.
Why does the creator use Fibonacci levels in their analysis?
-Fibonacci levels are used to identify potential support and resistance points in the stock's price movement. In this video, the creator uses these levels to forecast possible areas where Tesla's stock could experience rejection or support.
What is the significance of the Fibonacci levels at the green zones on the chart?
-The creator points out that Tesla's stock has been rejecting near the green Fibonacci levels, which are critical areas to watch for potential resistance. The stock's behavior at these levels could indicate whether it will continue its upward movement or face a pullback.
What are the potential support and resistance levels that the creator is monitoring for Tesla?
-The creator monitors several key levels: resistance is seen between the high 320s to low 330s, while short-term support is around 320, with further support at the 314-313 range. The creator also mentions the larger daily pennant pattern that could influence Tesla's price movement.
What does the creator mean by a 'dead cat bounce' in relation to Tesla's stock?
-A 'dead cat bounce' refers to a short-term recovery in a stock's price after a significant decline, followed by a further downward move. The creator suggests that Tesla's stock might be experiencing such a bounce after its earnings drop.
How does the creator view the long-term trend of Tesla's stock?
-The creator believes that Tesla's stock is currently in a period of 'chop' within a large pennant pattern, which suggests that the stock could remain volatile and range-bound for some time before making a decisive move.
What is the creator's opinion on the potential for a breakout or breakdown in Tesla's stock?
-The creator believes that Tesla's stock is building pressure within the pennant, and once a breakout or breakdown occurs, it could be a quick and aggressive move. A breakout above the high 330s to low 340s could lead to further bullish action, while a breakdown below the low 300s could result in a significant bearish move.
What does the creator say about the options flow for Tesla?
-The creator mentions that the options flow for Tesla has been mixed, with bullish activity in the middle of the day and bearish sentiment toward the end. This fluctuation in sentiment reflects uncertainty about the stock's short-term direction.
Outlines

此内容仅限付费用户访问。 请升级后访问。
立即升级Mindmap

此内容仅限付费用户访问。 请升级后访问。
立即升级Keywords

此内容仅限付费用户访问。 请升级后访问。
立即升级Highlights

此内容仅限付费用户访问。 请升级后访问。
立即升级Transcripts

此内容仅限付费用户访问。 请升级后访问。
立即升级


5.0 / 5 (0 votes)
