Independent Sample T- Test
Summary
TLDRThe video explains the concept of the independent sample t-test, a statistical method used to compare the average values of two distinct groups, such as gender, education, or economic status. It highlights how this test can be applied to practical problems, such as determining if there is a significant difference in tax compliance between men and women. The tutorial walks through data analysis using SPSS, showing how to interpret test results, with an example involving interest in buying products based on discounts. The goal is to help users understand how to formulate and test hypotheses using this statistical technique.
Takeaways
- 😀 Independent sample t-test is used to compare the mean or average values of two groups.
- 😀 The test is helpful when comparing two categories, such as gender (male vs. female), education level (high vs. low), or economic status (rich vs. poor).
- 😀 In the example of tax compliance, gender is the independent variable, and tax compliance is the dependent variable.
- 😀 The goal of the test is to determine whether there is a significant difference between the two groups, e.g., whether women have higher tax compliance than men.
- 😀 The independent sample t-test can only compare two groups, but there are other tests for more than two groups.
- 😀 The results of the test can inform decisions, such as targeted recommendations for groups with lower tax compliance.
- 😀 For example, if women are more compliant in paying taxes than men, the tax office could focus on socializing tax compliance to male taxpayers.
- 😀 In SPSS, the data from a study (e.g., integrated marketing communication research) can be used to apply the independent sample t-test.
- 😀 An example formulation of the problem is: 'Is there a difference in interest in buying a product based on gender groups?'
- 😀 The test in SPSS provides statistics, such as the mean values for men and women, and the significance value to determine whether the difference is significant.
- 😀 If the p-value is not significant, it means there is no substantial difference between the groups (e.g., men and women have similar interest in buying products because of discounts).
Q & A
What is an independent sample t-test used for?
-An independent sample t-test is used to compare the means or average values of two groups to determine if there is a significant difference between them.
Can you provide examples of categories where an independent sample t-test can be applied?
-Yes, examples include comparing gender (male vs. female), educational levels (high vs. low education), or economic status (rich vs. poor).
In the example of the gender and tax compliance study, which is the independent variable and which is the dependent variable?
-In this case, gender is the independent variable, while tax compliance is the dependent variable.
Why would comparing groups like gender or education be useful for a study?
-It allows researchers to identify if there are significant differences between groups in terms of behavior, preferences, or characteristics, and make recommendations based on these findings.
What kind of recommendations could be made based on the results of an independent sample t-test?
-For instance, if one group shows significantly different behavior, recommendations can be made to target that specific group for interventions, like tax compliance education for lower compliance groups.
How does the independent sample t-test work in SPSS, as mentioned in the example with the chocolates sales promotion?
-In SPSS, the independent sample t-test is conducted by inputting the data (e.g., interest in buying based on gender) and comparing the means of the two groups (men and women). The significance of the results is then analyzed.
What does it mean if the result of the t-test shows no significant difference?
-If the t-test result shows no significant difference, it means that the two groups (e.g., men and women) do not differ significantly in the characteristic being tested (e.g., interest in buying due to discounts).
In the SPSS output example, what was the conclusion regarding the difference between men and women in terms of interest in buying chocolicious products?
-The conclusion was that there was no significant difference in interest between men and women in buying chocolicious products due to discounts, as both groups showed similar levels of interest.
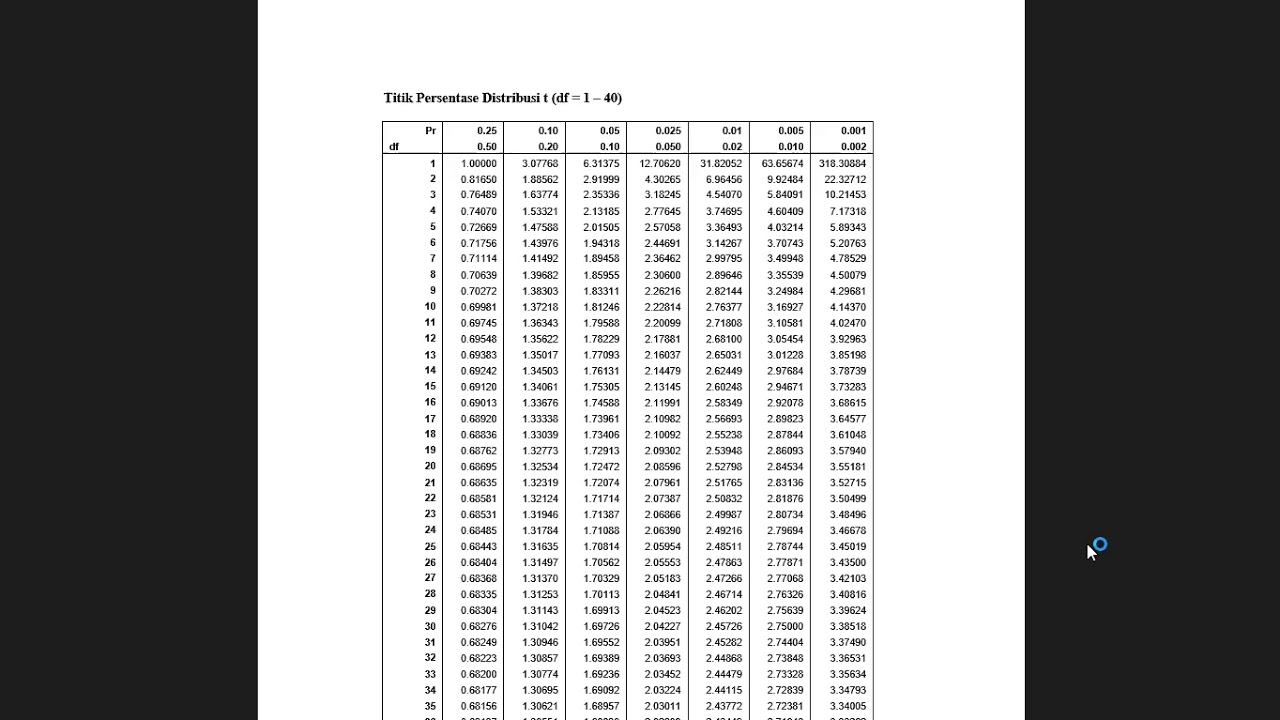
What should you check in the SPSS output if you want to confirm whether the results are significant?
-You should check the 'Levene's Test of Equality' column and the 'Sig.' value. If the 'Sig.' value is less than 0.05, the difference is significant. If it’s greater, there’s no significant difference.
What task is assigned to the students at the end of the session?
-Students are tasked with formulating a problem that can be tested using an independent sample t-test, similar to the example discussed during the session.
Outlines

此内容仅限付费用户访问。 请升级后访问。
立即升级Mindmap

此内容仅限付费用户访问。 请升级后访问。
立即升级Keywords

此内容仅限付费用户访问。 请升级后访问。
立即升级Highlights

此内容仅限付费用户访问。 请升级后访问。
立即升级Transcripts

此内容仅限付费用户访问。 请升级后访问。
立即升级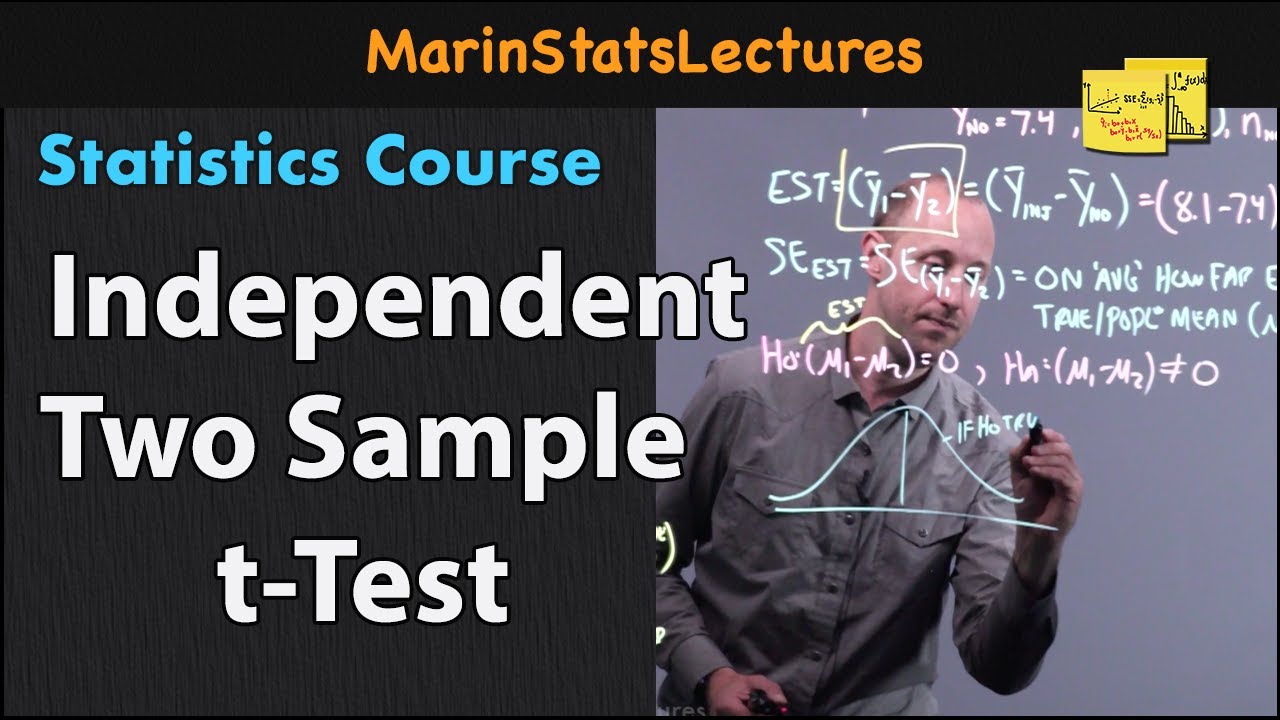


5.0 / 5 (0 votes)
