Independent-Samples T Test - Pertemuan 7
Summary
TLDRIn this video, Puspantara FIFA explains the concept and application of the Independent Sample T-Test using SPSS. The test is used to determine if there is a significant difference in the average scores between two independent groups, such as Class A and Class B. Through a practical demonstration, Puspantara guides viewers on how to set up the data, run the test, and interpret the results. He concludes that, based on the significance value, there is no significant difference between the two classes, suggesting that different teaching methods yield similar outcomes.
Takeaways
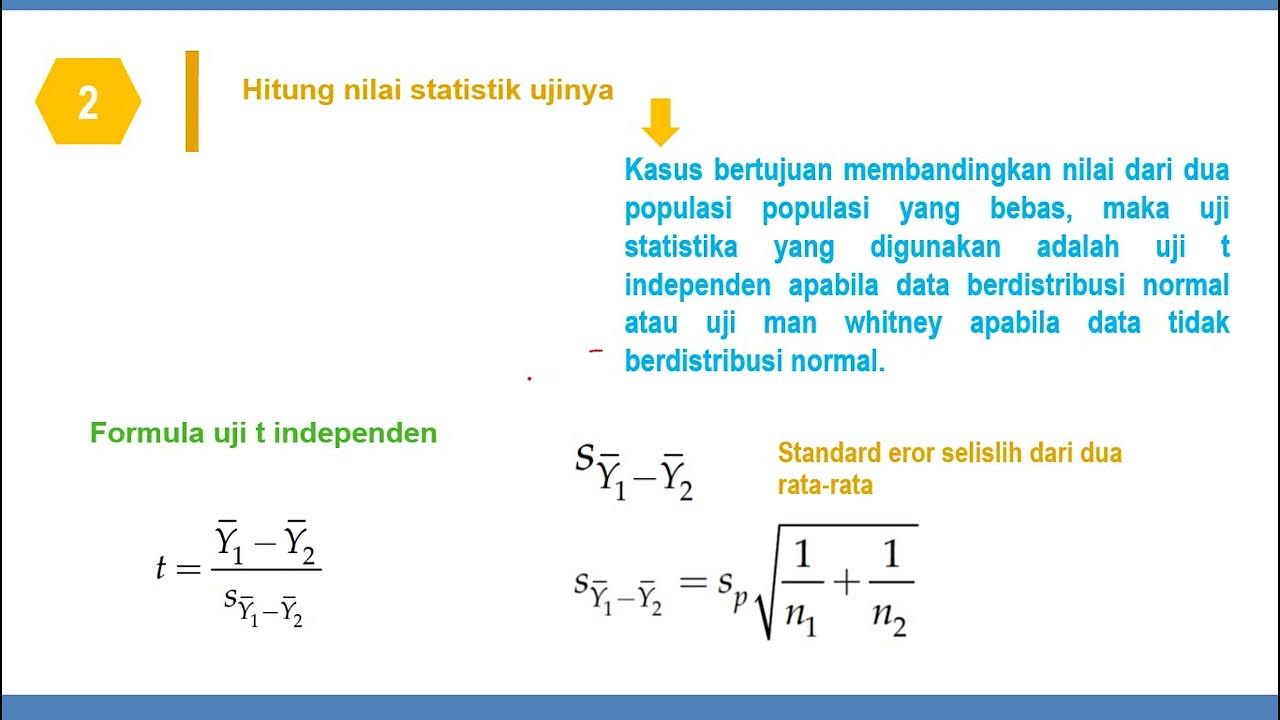
- 😀 The video introduces the concept of the Independent Sample T-test, a statistical method used to compare the means of two independent groups.
- 😀 The T-test helps determine whether there is a significant difference between the averages of two groups, such as comparing students' scores from two different classes.
- 😀 The key requirements for conducting an Independent Sample T-test are normal distribution and homogeneity of variance.
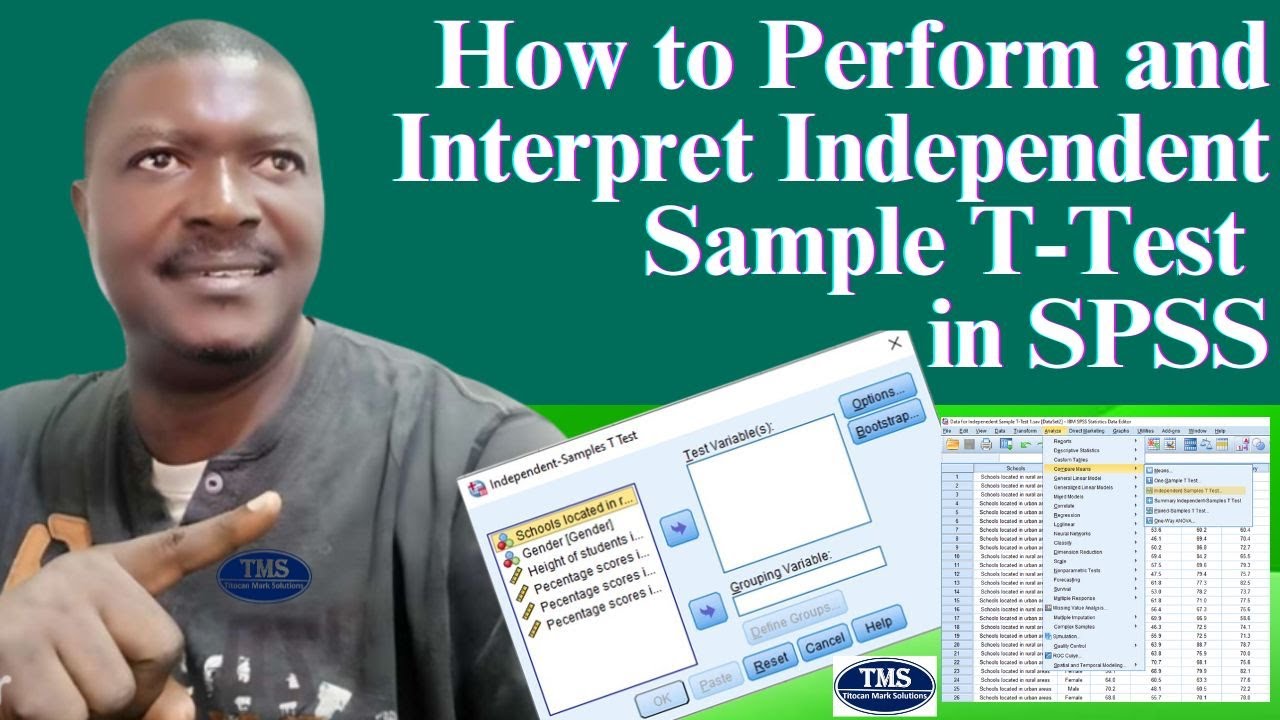
- 😀 The video uses SPSS software to demonstrate how to perform the Independent Sample T-test on sample data from two classes (Class A and Class B).
- 😀 The dataset in the example consists of student scores, and the goal is to compare the performance of two classes to determine if one performs better than the other.
- 😀 To prepare the data in SPSS, the video walks through how to define variables like class name, scores, and value labels.
- 😀 Before performing the T-test, the video suggests checking for normal distribution using SPSS’s Explore feature, referencing a previous tutorial on one-sample tests.
- 😀 The Independent Sample T-test is performed by selecting the appropriate test variables and grouping variables in SPSS, with a confidence interval set to 95%.
- 😀 The T-test result is interpreted using the significance value (p-value), which in this case was 0.233, indicating no significant difference between the two groups.
- 😀 Based on the result, the conclusion is that there is no significant difference between Class A and Class B, suggesting that both classes perform similarly despite using different teaching methods.
Q & A
What is the purpose of an independent sample t-test?
-The purpose of an independent sample t-test is to determine if there is a significant difference in the means of two independent samples that are not related to each other.
What are the prerequisites for conducting an independent sample t-test?
-The prerequisites for conducting an independent sample t-test include normal distribution and homogeneity of variances, similar to a one-sample t-test.
How do you set up variables in SPSS for an independent sample t-test?
-In SPSS, you set up the variables by labeling the data in 'Variable View'. For instance, label 'Class A' and 'Class B' as the two groups, with the data being numerical for the test results.
What does the 'Explore' function in SPSS help with before performing the t-test?
-The 'Explore' function in SPSS helps check if the data follows a normal distribution, which is a prerequisite for conducting the t-test.
What does the output of an independent sample t-test in SPSS include?
-The output of an independent sample t-test in SPSS includes group statistics (e.g., mean and standard deviation) and the results of the t-test, showing whether the difference between groups is statistically significant.
How is the significance of the t-test interpreted in SPSS?
-In SPSS, the significance value (p-value) is compared to a predefined threshold, typically 0.05. If the p-value is greater than the threshold (e.g., 0.233), it indicates that there is no significant difference between the two groups.
Why are 'Class A' and 'Class B' used in the example of the t-test?
-'Class A' and 'Class B' are used as examples to compare two groups of students with potentially different teaching methods to test if their test scores differ significantly.
What are the three ways to compare the results of a t-test?
-The three ways to compare the results of a t-test are: (1) comparing the significance value, (2) comparing the t-table, and (3) using the distribution curve.
What does the conclusion of the t-test suggest when the p-value is greater than 0.05?
-If the p-value is greater than 0.05, the conclusion is that there is no significant difference between the two groups, meaning that the methods used in Class A and Class B yield similar results.
Why is an independent sample t-test used in this example rather than a paired t-test?
-An independent sample t-test is used because the students in 'Class A' and 'Class B' are from different groups, meaning their results are independent and not paired, making the independent t-test the appropriate choice.
Outlines

This section is available to paid users only. Please upgrade to access this part.
Upgrade NowMindmap

This section is available to paid users only. Please upgrade to access this part.
Upgrade NowKeywords

This section is available to paid users only. Please upgrade to access this part.
Upgrade NowHighlights

This section is available to paid users only. Please upgrade to access this part.
Upgrade NowTranscripts

This section is available to paid users only. Please upgrade to access this part.
Upgrade Now


5.0 / 5 (0 votes)