STATISTIKA : nilai jangkauan banyak kelas panjang kelas dan menyusun tabel distribusi frekuensi
Summary
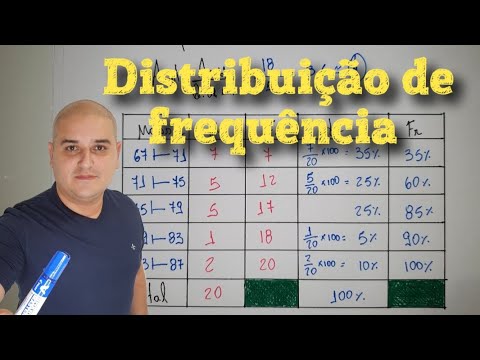
TLDRIn this educational video, the presenter explains how to create a frequency distribution table from a set of random data. The process includes sorting the data, calculating range, class count, and class width. Key formulas are provided for each step, and the video emphasizes the importance of rounding class counts when necessary. The tutorial also demonstrates the actual construction of a distribution table using an example dataset. The video concludes with a reminder to practice the concepts through a similar problem, offering both clear explanations and practical applications for students learning statistical analysis.
Takeaways
- 😀 The script explains how to create a frequency distribution table from a set of data.
- 😀 The first step is to arrange the data in ascending order to make further calculations easier.
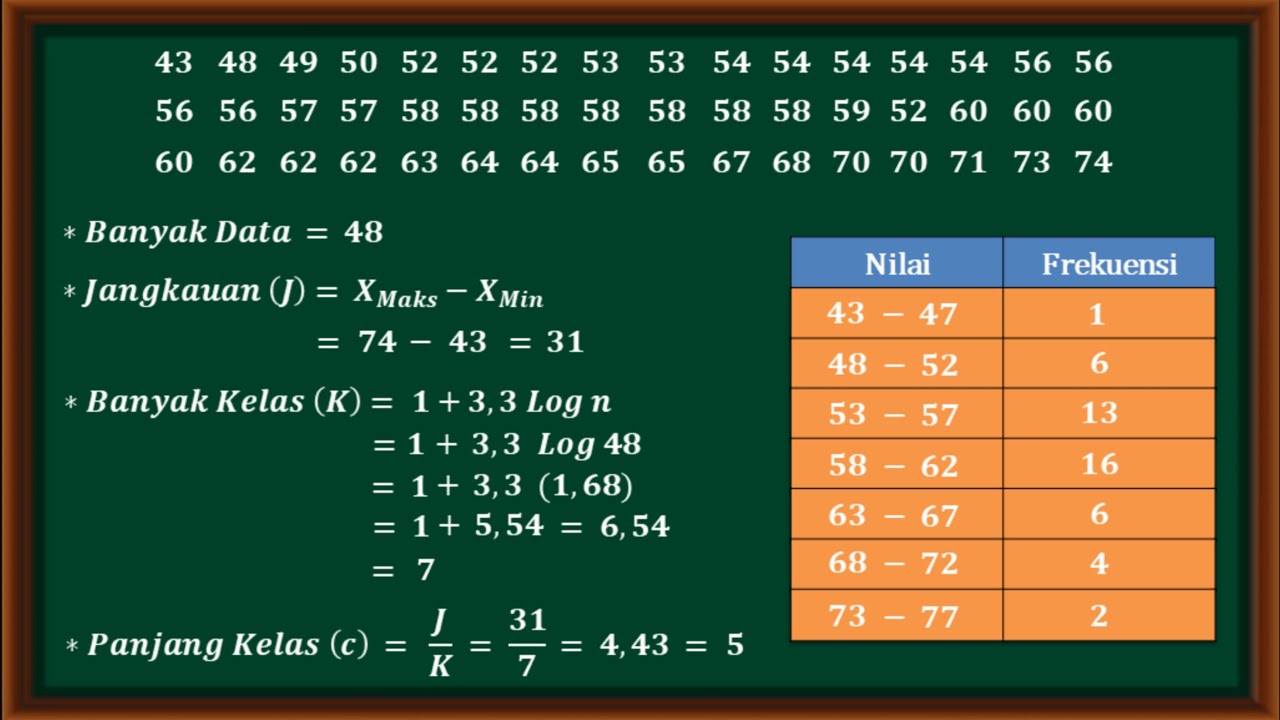
- 😀 The range of the data is calculated by subtracting the smallest value from the largest value.
- 😀 To determine the number of classes, use the formula: k = 1 + 3.3 log n, where n is the number of data points.
- 😀 The result from the formula for the number of classes may need to be rounded up to ensure all data fits into the table.
- 😀 The class width (length of each class) is calculated by dividing the range by the number of classes.
- 😀 If the class width results in a decimal, round it up to the nearest whole number to maintain consistency in the table.
- 😀 The table starts with the smallest data value, and each class range includes an equal number of data points.
- 😀 Once the classes are defined, frequencies (the number of data points within each class range) are counted and filled into the table.
- 😀 The script emphasizes that rounding the number of classes and class width appropriately is important for ensuring all data is included in the table.
Q & A
What is the first step in creating a frequency distribution table?
-The first step is to sort the data in ascending order, from the smallest to the largest number.
Why is sorting the data important before proceeding with the frequency distribution?
-Sorting the data helps to organize it and simplifies the process of determining the range and other calculations needed for the table.
What is the formula for calculating the range (J)?
-The formula for calculating the range is J = X_max - X_min, where X_max is the largest value and X_min is the smallest value in the dataset.
What is the purpose of calculating the number of classes in a frequency distribution?
-The number of classes helps determine how the data will be grouped in the table. It is calculated using the formula k = 1 + 3.3 log n, where n is the number of data points.
How do you calculate the number of classes (k)?
-To calculate the number of classes, first count the number of data points (n), then apply the formula k = 1 + 3.3 log n. In this case, n is 80, and the result should be rounded to the nearest whole number.
When should you round the number of classes up instead of down?
-You should round up when, after setting the table with the calculated number of classes, some data does not fit into the last class. This ensures that all data points are included.
What is the formula for calculating the class width (P)?
-The class width (P) is calculated by dividing the range (J) by the number of classes (k), i.e., P = J / k.
What should you do if the class width is not a whole number?
-The class width should be rounded to the nearest whole number to make the table easier to read and understand.
How do you fill in the frequency (f) column of the distribution table?
-To fill in the frequency column, count how many data points fall within each class range. For example, from 53 to 58, count how many numbers are in that range.
What is the significance of using 6 as the class width in this example?
-In this example, the class width of 6 is chosen because it ensures that all data points are grouped correctly into the frequency table. This width was determined after rounding the calculated class width to the nearest whole number.
Outlines

此内容仅限付费用户访问。 请升级后访问。
立即升级Mindmap

此内容仅限付费用户访问。 请升级后访问。
立即升级Keywords

此内容仅限付费用户访问。 请升级后访问。
立即升级Highlights

此内容仅限付费用户访问。 请升级后访问。
立即升级Transcripts

此内容仅限付费用户访问。 请升级后访问。
立即升级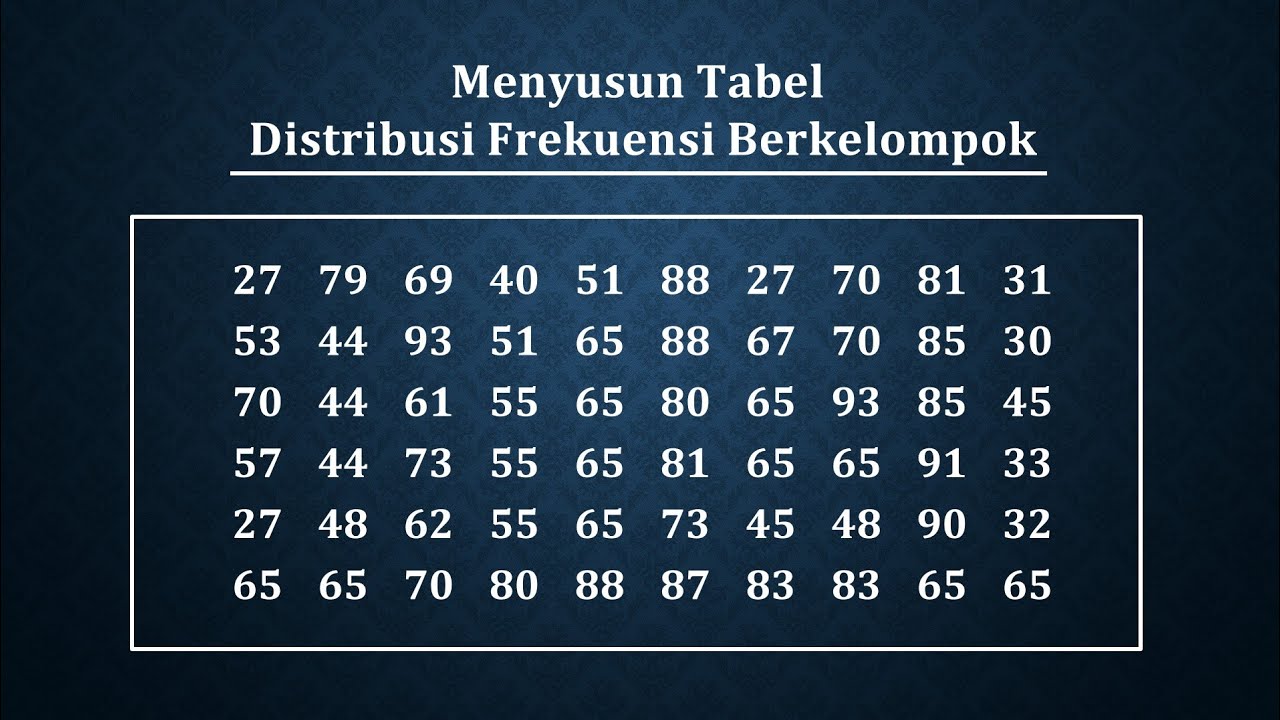

5.0 / 5 (0 votes)
