Cara menyusun tabel distribusi frekuensi berkelompok
Summary
TLDRThis tutorial video explains how to create a grouped frequency distribution table from a given set of data. The process includes sorting the data, calculating the range, determining the number of classes using a formula, and finding the class width by dividing the range by the number of classes. The video walks through each step in detail, highlighting the importance of rounding the class width up to ensure no data is omitted. By the end of the tutorial, viewers will have a clear understanding of how to organize data into a frequency distribution table efficiently.
Takeaways
- 😀 Always start by organizing the given data in ascending order before proceeding with further steps.
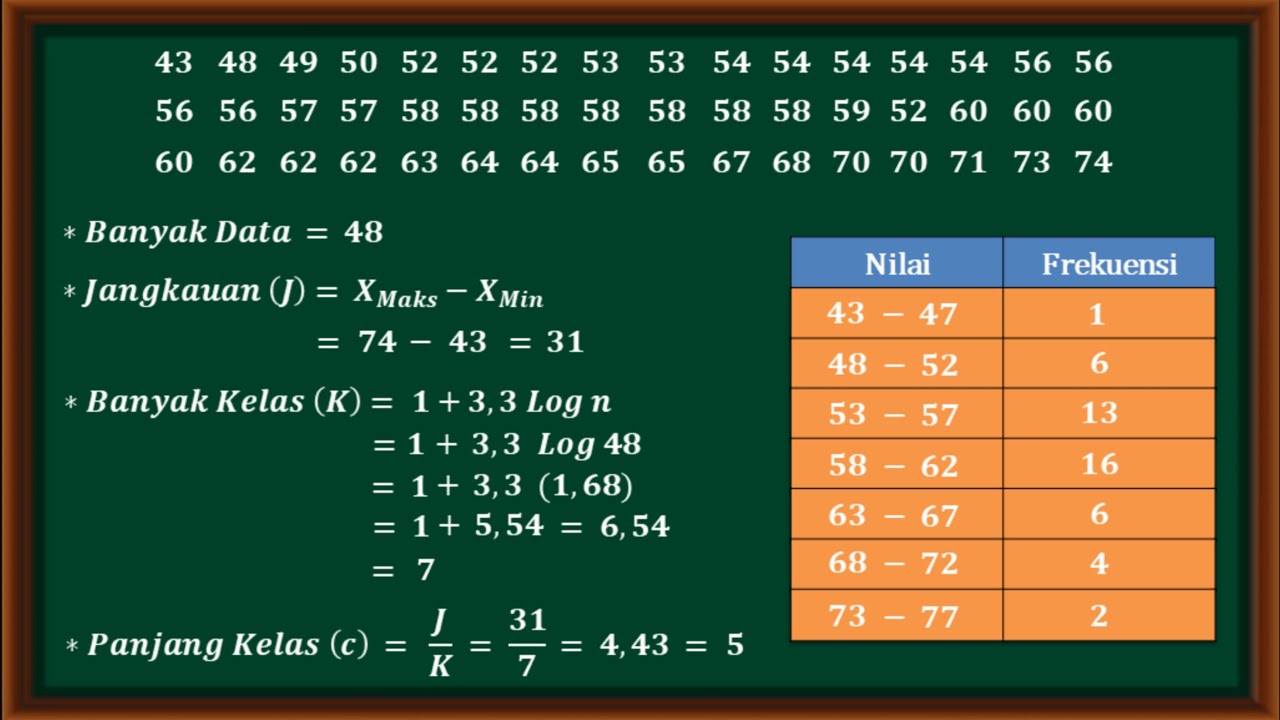
- 😀 🧮 To calculate the range of the data, subtract the minimum value (X_min) from the maximum value (X_max).
- 😀 📊 Use the formula '1 + 3.3 log n' to determine the number of classes needed for the frequency distribution table.
- 😀 🔢 The total number of data points (n) is crucial when calculating the number of classes. In this case, there are 60 data points.
- 😀 🧑🏫 For a precise result, use a calculator to determine the logarithmic value of n, especially when dealing with large numbers like 60.
- 😀 📏 Once the number of classes is found, calculate the class width by dividing the range by the number of classes.
- 😀 🔺 Always round up the class width, even if it’s a decimal. For example, a class width of 9.4 should be rounded to 10.
- 😀 ✅ A frequency distribution table includes the class intervals and the corresponding frequency of data points within each class.
- 😀 🔢 In constructing the table, start with the smallest data point and incrementally add the class width until you reach the largest value.
- 😀 📋 The frequency of each class is determined by counting how many data points fall within each class interval.
- 😀 📝 A properly constructed frequency distribution table helps visualize the data, making it easier to analyze the distribution.
Q & A
What is the first step in creating a frequency distribution table with grouped data?
-The first step is to sort the given data from the smallest to the largest value. This makes it easier to organize and create the table.
How do you calculate the range of the data?
-To calculate the range, subtract the smallest value (X min) from the largest value (X max). In the example, it is 93 - 27, which equals 66.
What is the formula for calculating the number of classes in a frequency distribution?
-The formula to calculate the number of classes is 1 + 3.3 * log(n), where n is the total number of data points. In the example, with 60 data points, the formula gives approximately 7 classes.
Why is the value of the number of classes rounded up to 7?
-The value of the number of classes (6.9) is rounded up to 7 because it ensures that no data is left out when constructing the table. Rounding ensures all data is accounted for.
How is the class width (or class length) determined?
-The class width is determined by dividing the range by the number of classes. In this case, 66 (range) divided by 7 (number of classes) results in approximately 9.428, which is then rounded up to 10.
Why is the class width always rounded up to the nearest whole number?
-The class width is rounded up to avoid any gaps between the classes and ensure that all data points fit into the groups, preventing any data from being left out.
What does the table of grouped frequency distribution contain?
-The table contains two main columns: one for the class intervals (ranges of values) and another for the frequency (the number of data points within each class interval).
How do you determine the frequency for each class interval?
-To determine the frequency, count how many data points fall within each class interval. For example, the class interval 27-36 contains 7 numbers, so the frequency is 7.
What is the purpose of creating a frequency distribution table?
-The purpose of creating a frequency distribution table is to organize and summarize data in a way that is easy to understand, allowing for easier analysis and interpretation of the data.
What is the final step after constructing the class intervals and frequencies?
-The final step is to complete the table by filling in the frequency for each class interval, ensuring that all the data points are accounted for in the distribution.
Outlines

This section is available to paid users only. Please upgrade to access this part.
Upgrade NowMindmap

This section is available to paid users only. Please upgrade to access this part.
Upgrade NowKeywords

This section is available to paid users only. Please upgrade to access this part.
Upgrade NowHighlights

This section is available to paid users only. Please upgrade to access this part.
Upgrade NowTranscripts

This section is available to paid users only. Please upgrade to access this part.
Upgrade NowBrowse More Related Video
Cara mudah menyusun tabel distribusi kelompok
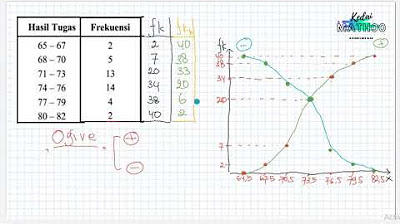
Statistika Deskriptif (Bag 1): Cara Membuat dan Membaca OGIVE
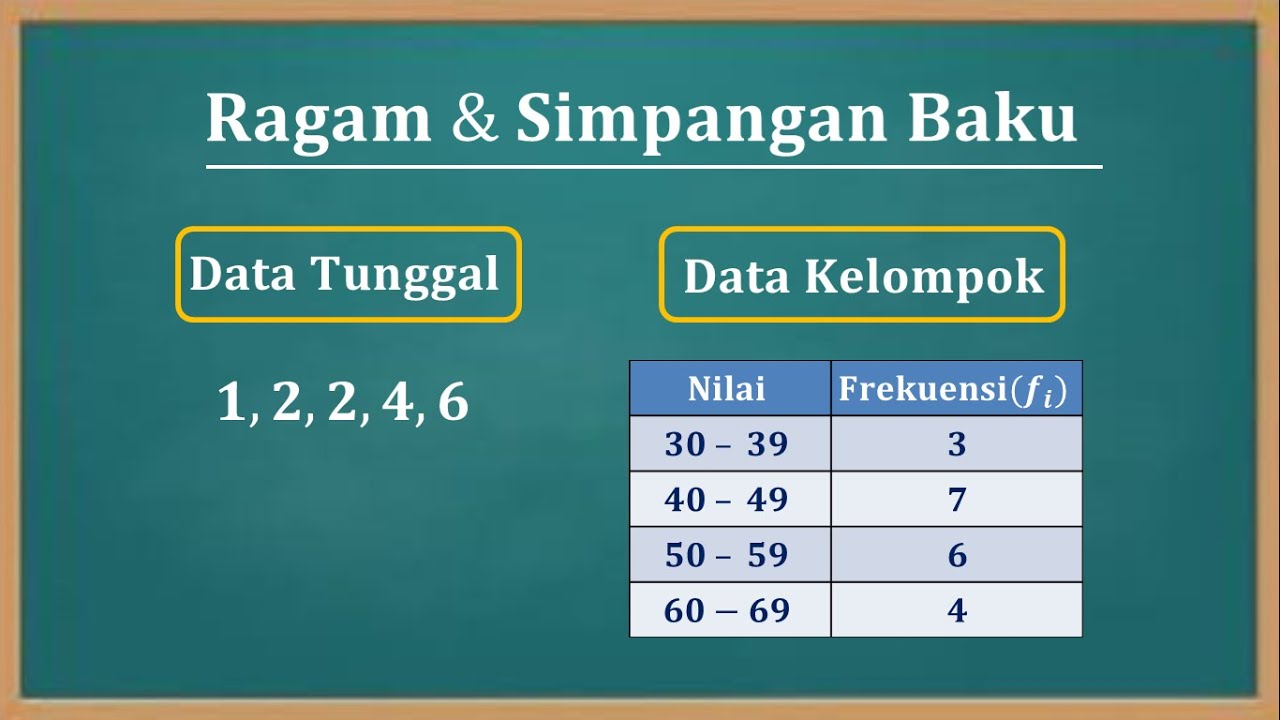
Cara menentukan nilai varian (Ragam) dan Standar deviasi (Simpangan baku) data tunggal dan kelompok

STATISTIKA : nilai jangkauan banyak kelas panjang kelas dan menyusun tabel distribusi frekuensi
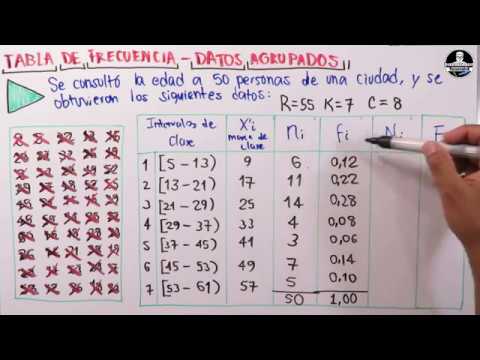
Aprende a construir una Tabla de frecuencia con datos agrupados

CARA PENYAJIAN DATA KELOMPOK - MATEMATIKA SMA
5.0 / 5 (0 votes)