Cara mudah menyusun tabel distribusi kelompok
Summary
TLDRThis video tutorial provides a step-by-step guide on how to create a grouped frequency distribution table in statistics. The process includes sorting data, calculating the range, determining the number of classes and class width, and then organizing the data into intervals. The tutorial also explains the reasoning behind rounding up decimals when calculating classes and class width to avoid missing data. By the end of the video, viewers will understand how to create a clear and organized frequency distribution table, making data analysis more manageable and insightful.
Takeaways
- 😀 Sorting the data in ascending order is the first step in creating a grouped frequency distribution table.
- 😀 The range is calculated by subtracting the smallest value from the largest value in the data set.
- 😀 The formula for calculating the number of classes is 1 + 3.3 * log(n), where n is the number of data points.
- 😀 The number of classes is always rounded up if the result is a decimal to ensure all data points are included.
- 😀 Class width is calculated by dividing the range by the number of classes, and rounding up if necessary.
- 😀 Rounding up ensures that no data is missed or left out of the distribution table.
- 😀 A frequency distribution table consists of intervals (classes) and the frequency of data points that fall within each interval.
- 😀 To calculate frequencies, count how many data points fall into each class interval.
- 😀 When calculating frequencies, it’s important to check the correct number of values within each interval to avoid errors.
- 😀 The speaker advises confirming with a teacher whether rounding is done by conventional rules or as per the specific book guidelines.
Q & A
What is the first step in creating a grouped frequency distribution table?
-The first step is to arrange the data in ascending order, from the smallest to the largest value.
How is the range of the data calculated in this tutorial?
-The range is calculated by subtracting the smallest value (Xmin) from the largest value (Xmax). In this case, the range is 74 - 43 = 31.
What formula is used to calculate the number of classes (K)?
-The number of classes (K) is calculated using the formula: K = 1 + 3.3 * log(n), where 'n' is the total number of data points.
What was the calculated number of classes (K) in this example, and how was it determined?
-The number of classes (K) was calculated as 7, using the formula 1 + 3.3 * log(48), which gives 1 + 3.3 * 1.68 = 7.
How is the class width (C) determined?
-The class width (C) is determined by dividing the range by the number of classes. In this case, C = 31 / 7 = 4.43, which is rounded up to 5.
Why is the class width and number of classes rounded up when necessary?
-The class width and number of classes are rounded up to ensure that no data points are left out or missed when creating the frequency distribution table.
How are the class intervals determined?
-The class intervals are determined by starting with the smallest value in the data set (43), and then adding the class width (5) sequentially to create each interval. For example, the first class interval is 43-47, followed by 48-52, and so on.
How do you calculate the frequency for each class interval?
-The frequency for each class interval is calculated by counting how many data points fall within that specific range. For example, for the interval 43-47, there is only one data point.
What was the frequency for the class interval 53-57?
-The frequency for the class interval 53-57 was 13, as there were 13 data points within this range.
Why is it important to use a grouped frequency distribution table?
-A grouped frequency distribution table is important because it helps organize large data sets into intervals or ranges, making it easier to analyze and interpret the data, especially when the data contains a wide range of values.
Outlines

This section is available to paid users only. Please upgrade to access this part.
Upgrade NowMindmap

This section is available to paid users only. Please upgrade to access this part.
Upgrade NowKeywords

This section is available to paid users only. Please upgrade to access this part.
Upgrade NowHighlights

This section is available to paid users only. Please upgrade to access this part.
Upgrade NowTranscripts

This section is available to paid users only. Please upgrade to access this part.
Upgrade NowBrowse More Related Video
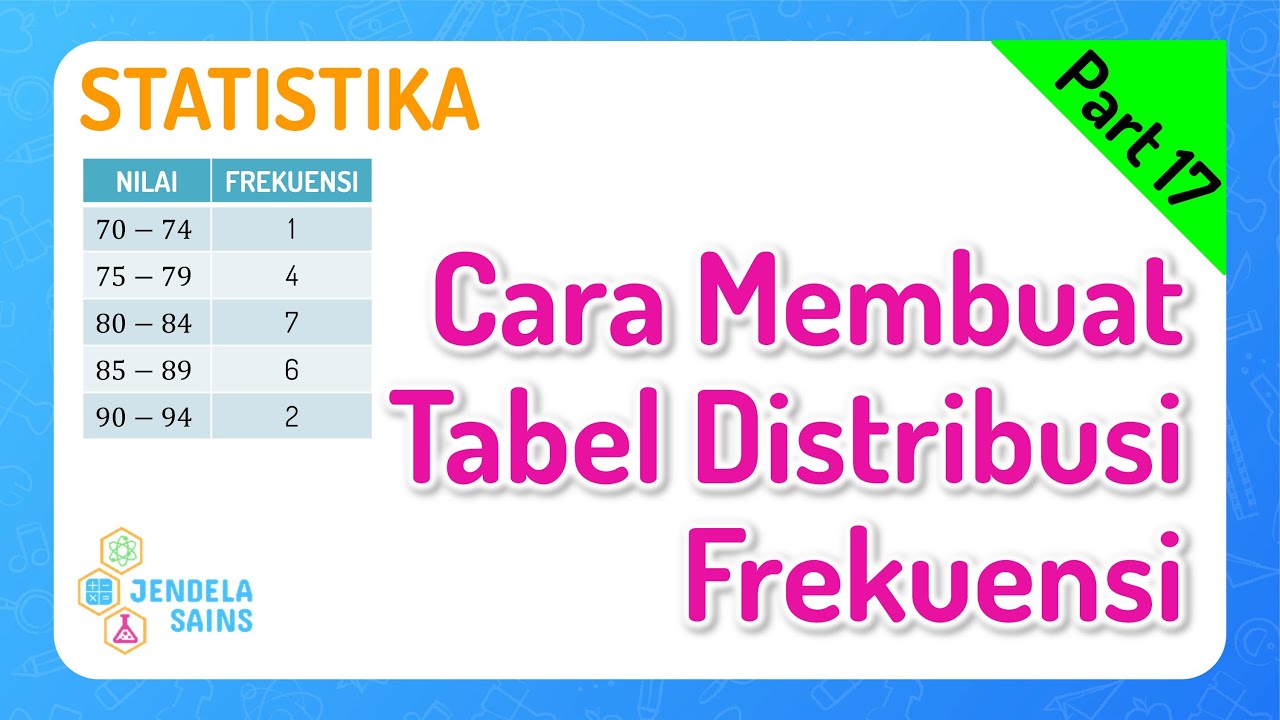
Statistika • Part 17: Cara Membuat Tabel Distribusi Frekuensi
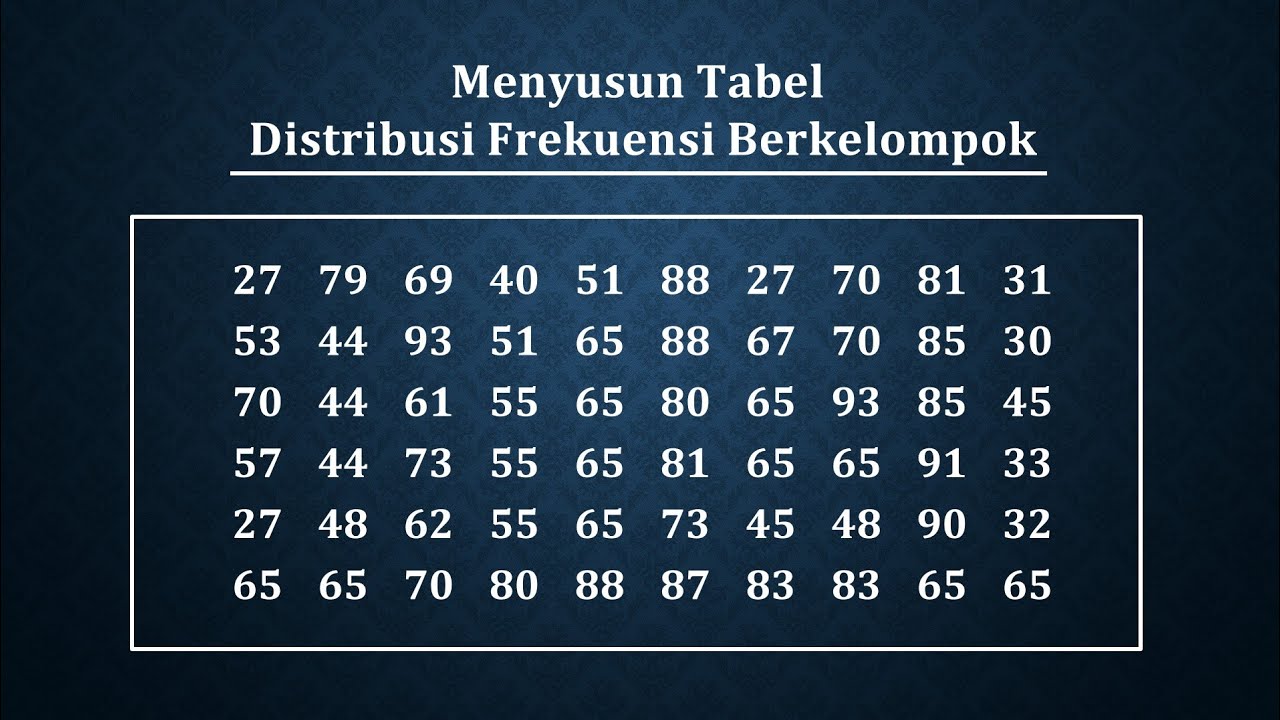
Cara menyusun tabel distribusi frekuensi berkelompok
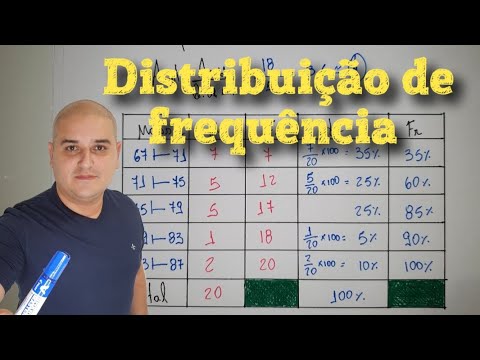
Distribuição de frequência com classes
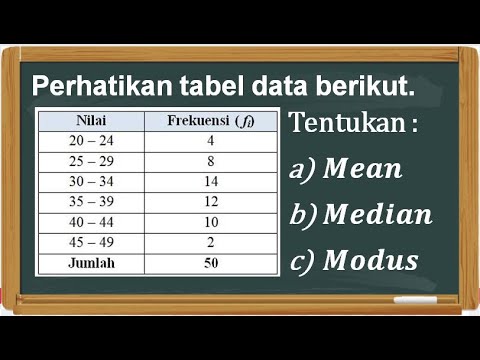
Menentukan Mean, Median, dan Modus Data Kelompok

Statistika (Distribusi Frekuensi Data Tunggal dan Kelompok)

Measure of Central Tendency of Grouped Data for beginners
5.0 / 5 (0 votes)