Data Mining 09 - Korelasi & Analisa Regresi (1/2)
Summary
TLDRThis video introduces supervised learning, focusing on regression analysis for predicting numerical data. It explains key concepts like covariance, variance, and correlation, emphasizing the importance of understanding linear relationships between variables. The video explores regression models, starting with simple linear regression and progressing to multiple linear regression. It highlights the difference between correlation and causality and underscores the need for further research to establish cause-and-effect relationships. The tutorial also discusses regression functions and optimization techniques, setting the stage for deeper learning in statistical modeling and prediction.
Takeaways
- 😀 Supervised learning involves training a model on labeled data to make predictions about numerical or categorical variables.
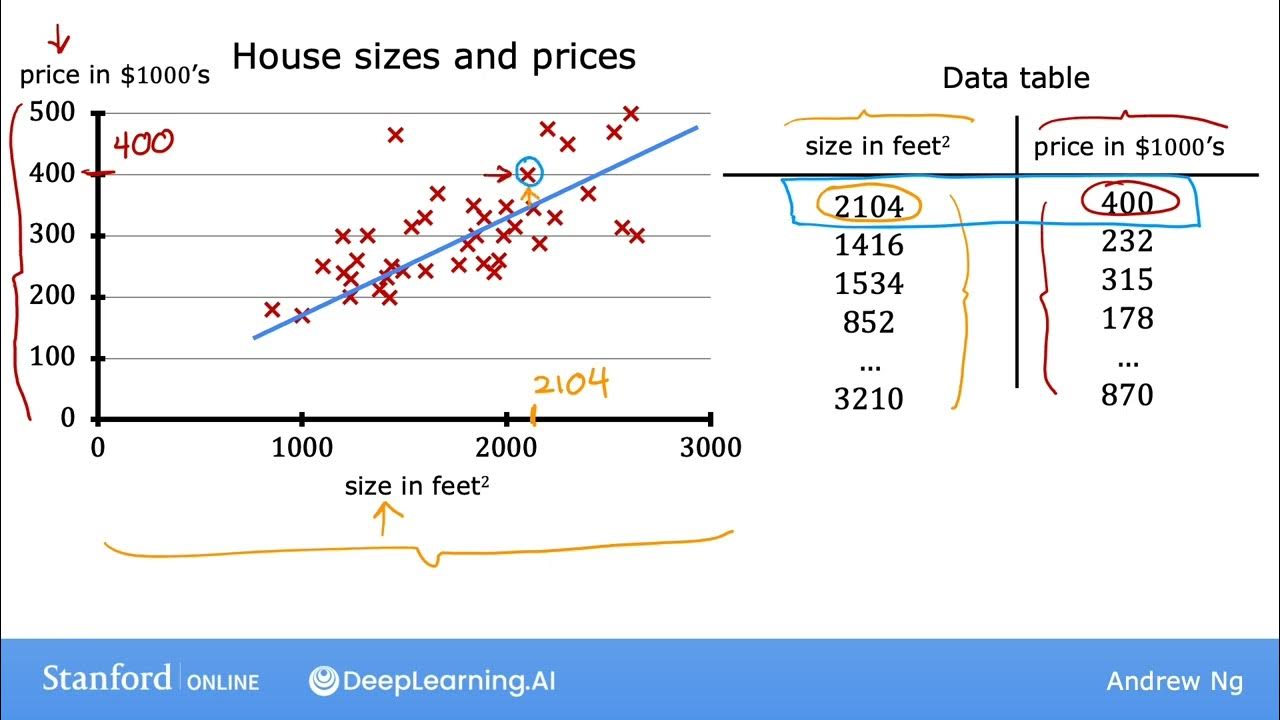
- 😀 Regression analysis is a method used for predicting numerical data based on relationships between variables.
- 😀 In the given example, age and blood pressure are used as variables, and their relationship is analyzed using basic statistics.
- 😀 The mean and variance of both age and blood pressure are calculated as a first step in understanding their relationship.
- 😀 Covariance measures the linear relationship between two variables, such as age and blood pressure, but does not provide a normalized value.
- 😀 Correlation is the normalized version of covariance and ranges from -1 to 1, indicating the strength and direction of the relationship.
- 😀 A positive correlation means both variables increase together, while a negative correlation means one variable increases as the other decreases.
- 😀 Thresholds for interpreting correlation values, such as 0.8 to 0.99 for strong correlation, are not fixed and depend on the context of the application.
- 😀 It is important to remember that correlation does not imply causation, as there may be other influencing variables (confounding variables).
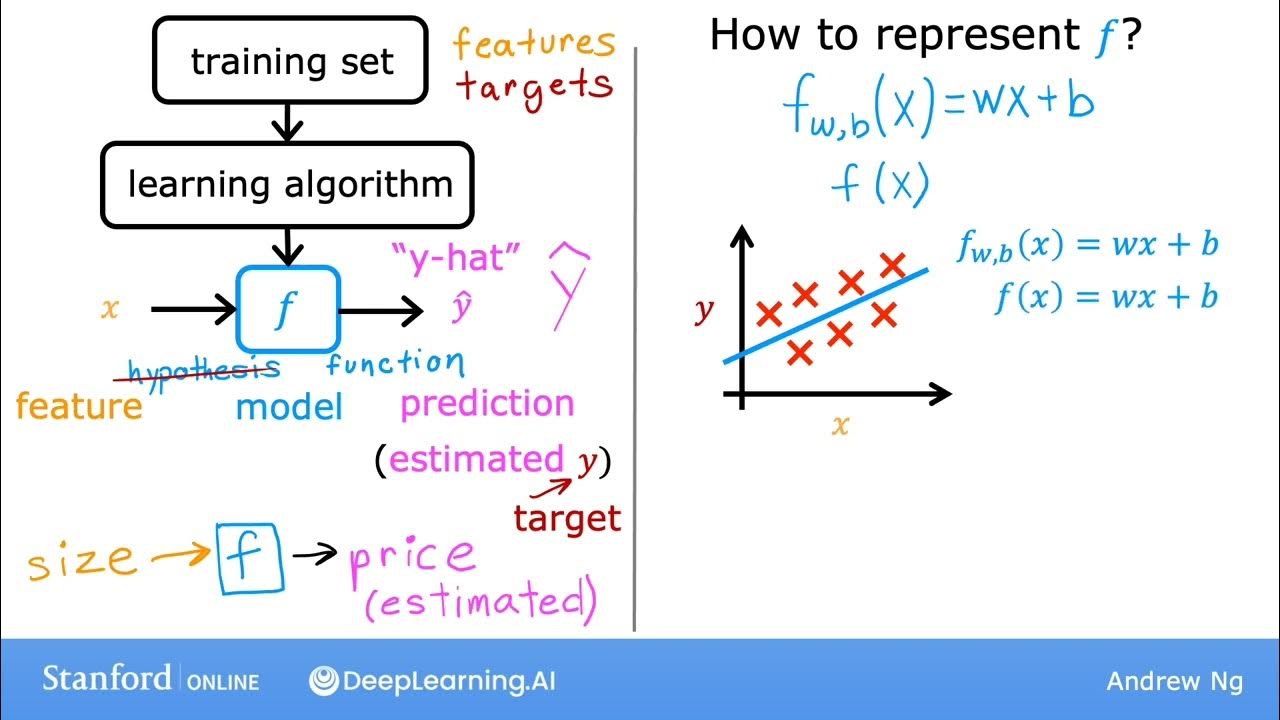
- 😀 A simple linear regression model predicts a dependent variable (Y) based on an independent variable (X), with the equation Y = β0 + β1X + ε.
- 😀 Multiple linear regression expands on simple linear regression by considering more than one independent variable to predict the dependent variable.
- 😀 The goal in regression modeling is to minimize the error (or residual) between the predicted and actual values, often done by defining a loss function.
Q & A
What is the focus of this lesson?
-This lesson focuses on supervised learning, specifically regression analysis, which is used for predicting numeric data.
What are the two variables discussed in the example dataset?
-The two variables in the example dataset are age and blood pressure.
How do you calculate the average in regression analysis?
-To calculate the average, you compute the mean of the age values and the mean of the blood pressure values separately.
What is the formula for covariance?
-The formula for covariance is the sum of the products of the differences between each value and its mean, divided by the number of data points minus 1.
How does covariance relate to the relationship between two variables?
-Covariance measures the linear relationship between two variables. A positive covariance indicates that as one variable increases, the other also increases, while a negative covariance indicates the opposite.
Why is correlation important in regression analysis?
-Correlation is important because it normalizes covariance and gives a more interpretable measure of the strength and direction of a linear relationship between two variables, with values between -1 and 1.
What does a correlation value close to 1 or -1 indicate?
-A correlation value close to 1 or -1 indicates a very strong linear relationship, either positive (1) or negative (-1) between the variables.
What is the key distinction between correlation and causation?
-Correlation does not imply causation. A strong correlation between two variables does not mean that one variable causes the other; there could be other factors involved.
What is the purpose of regression models in supervised learning?
-Regression models are used to predict a numeric dependent variable based on one or more independent variables, helping to understand relationships and make predictions.
What is the formula for simple linear regression?
-The formula for simple linear regression is y = β₀ + β₁x + ε, where y is the dependent variable, β₀ is the intercept, β₁ is the slope, x is the independent variable, and ε represents the error term.
How does multiple regression extend simple linear regression?
-Multiple regression extends simple linear regression by incorporating more than one independent variable. The formula becomes y = β₀ + β₁x₁ + β₂x₂ + ... + βₙxₙ + ε.
What is the purpose of minimizing the loss function in regression?
-The loss function is minimized to find the optimal values of the regression parameters (β₀, β₁, etc.) that reduce the error between the predicted and actual values.
Outlines

此内容仅限付费用户访问。 请升级后访问。
立即升级Mindmap

此内容仅限付费用户访问。 请升级后访问。
立即升级Keywords

此内容仅限付费用户访问。 请升级后访问。
立即升级Highlights

此内容仅限付费用户访问。 请升级后访问。
立即升级Transcripts

此内容仅限付费用户访问。 请升级后访问。
立即升级浏览更多相关视频

Supervised vs. Unsupervised Learning
#9 Machine Learning Specialization [Course 1, Week 1, Lesson 3]

TYPES OF MACHINE LEARNING-Machine Learning-20A05602T-UNIT I – Introduction to Machine Learning

Classification & Regression.
#10 Machine Learning Specialization [Course 1, Week 1, Lesson 3]

Aprendizado de Máquina: Supervisionado e Não Supervisionado
5.0 / 5 (0 votes)
