Prosedur Analisa Logam dengan Instrumen AAS GBC (Software AAS GBC)
Summary
TLDRThis tutorial provides a step-by-step guide on how to use the JVC software for metal analysis, specifically potassium, using the AAS JVC 93-12 instrument. It covers everything from setting up the method and calibrating the instrument to preparing samples and generating results. The video demonstrates how to configure analysis settings, input sample data, and produce accurate readings, ensuring proper calibration and precision. With clear instructions and practical tips, the tutorial is designed to help users effectively utilize the software and achieve reliable results in their metal analysis tasks.
Takeaways
- 😀 Ensure the correct lamp is installed and properly set up before starting the analysis process.
- 😀 The software interface includes menus for method selection, sample analysis, and result reporting.
- 😀 Start by creating a new method, selecting the element to be analyzed (e.g., potassium), and configuring the analysis parameters.
- 😀 When setting up a method, choose the appropriate wavelength and instrument settings for accurate analysis.
- 😀 Calibration must be done using the linear regression method (Least Squares) for best results.
- 😀 Set up standard concentrations and ensure that the calibration curve meets the desired accuracy, with r² values above 0.95 for reliable results.
- 😀 The software allows the creation of standard samples (e.g., 0.1 mg/L, 0.2 mg/L) for precise calibration and measurement.
- 😀 Always perform a blank solution reading before starting sample analysis to ensure the instrument is properly calibrated.
- 😀 Samples should be named clearly, and you should perform multiple readings to ensure accuracy in the results.
- 😀 After completing the analysis, results can be reviewed and printed, ensuring the correct printer is selected for output.
Q & A
What is the purpose of the tutorial in the provided transcript?
-The tutorial explains how to use the JVC software and instrument for assessing potassium levels in samples using a specific analysis method (AAS JBC 93 12).
What is the first step in using the JVC software for analysis?
-The first step is to ensure that the correct lamp is installed in the instrument, corresponding to the element to be analyzed (in this case, potassium).
How do you select the analysis method in the JVC software?
-To select the analysis method, you need to choose the appropriate element (e.g., potassium) in the software, adjust the wavelength, and set up the instrument properties such as integration time and mode.
What is the significance of calibration in the analysis process?
-Calibration is crucial as it ensures the accuracy of the analysis by creating a standard curve using known concentrations. The method used is linear least squares, and the R-squared value must be above 0.95 for accurate results.
How do you set up the calibration standards in the JVC software?
-You set up the calibration standards by defining their concentrations, such as 0.1, 0.2, 0.5, 1, and 2 mg/L, within the software, and then adding them to the analysis sequence.
What should you do if the R-squared value of the calibration curve is below 0.95?
-If the R-squared value is below 0.95, it indicates that the calibration curve is not reliable, and you need to repeat the calibration process to obtain a better curve.
What does the software do after the calibration is successful?
-Once the calibration is successful, the software proceeds to analyze the sample, reads the blank solution, standards, and the samples in the specified sequence.
How do you perform the sample analysis after calibration?
-You perform the sample analysis by inserting the capillary tube into the sample, starting the analysis sequence, and reading the results after each sample, ensuring proper order and settings.
What is the purpose of the 'Running Man' mode in the analysis?
-The 'Running Man' mode is a reading mode that collects data over a specified integration time. It is chosen here to ensure optimal readings during the sample analysis process.
How can the results of the analysis be saved and printed?
-The results can be saved as a research file and printed using the software. The printout can be adjusted to the preferred printer settings and includes the analysis data.
Outlines

此内容仅限付费用户访问。 请升级后访问。
立即升级Mindmap

此内容仅限付费用户访问。 请升级后访问。
立即升级Keywords

此内容仅限付费用户访问。 请升级后访问。
立即升级Highlights

此内容仅限付费用户访问。 请升级后访问。
立即升级Transcripts

此内容仅限付费用户访问。 请升级后访问。
立即升级浏览更多相关视频

Population genetics Analysis in STRUCTURE Software | Molecular Data| | Admixture|StudentsCanCreate

PRAKTIKUM GEOKIMIA-Teknik Preparasi Sampel AAS
Reliability Analysis using minitab 18
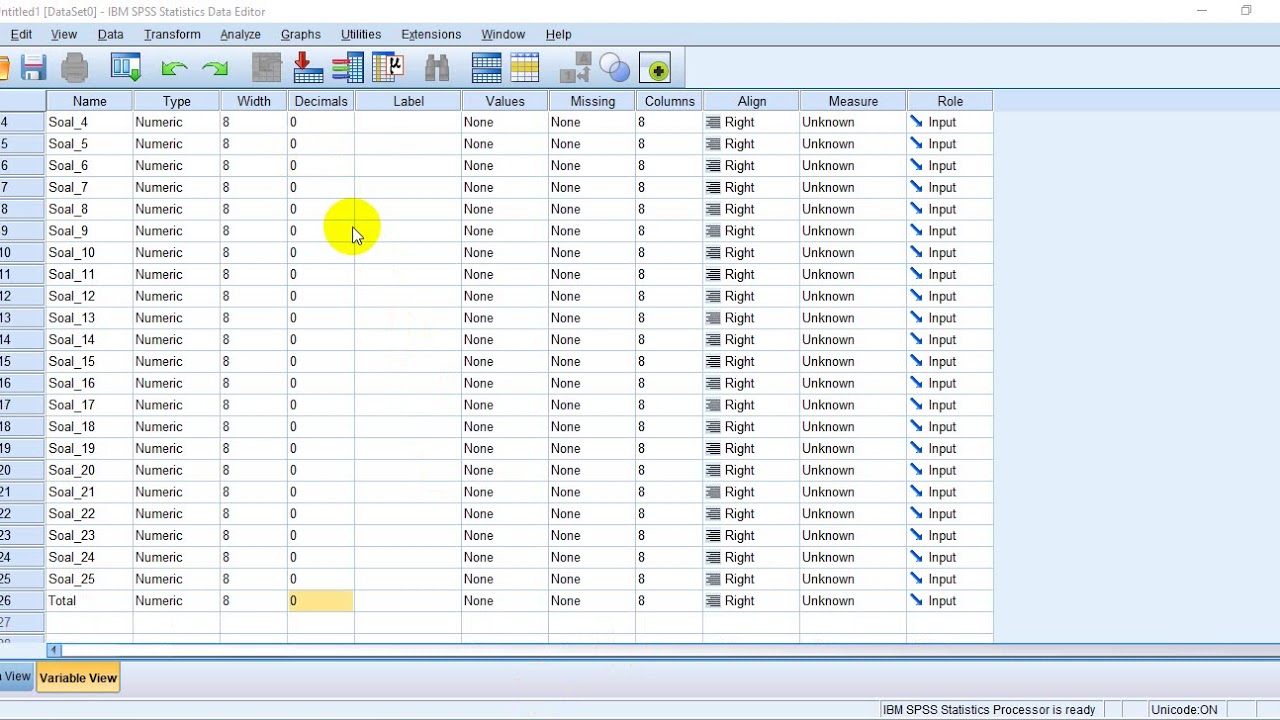
Menentukan Nilai Validitas dan Reliabilitas Soal Pilihan Ganda Menggunakan SPSS

Tutorial Molecular Docking dan Mendapatkan Energi HOMO-LUMO
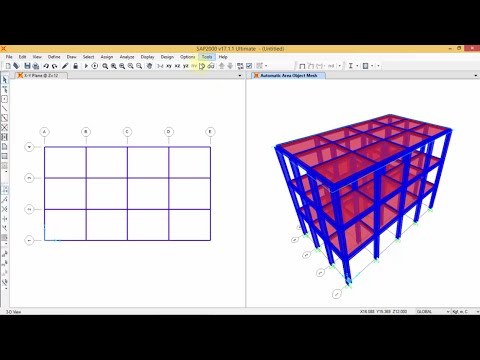
SAP 2000 - Analisa Struktur Baja (SNI)
5.0 / 5 (0 votes)
