Modul 6 - Uji Beda Rata rata Dua Sampel Berpasangan (Dependen) (Paired Sample t-test)
Summary
TLDRThe video guides viewers through conducting a paired sample t-test, comparing the effectiveness of a training program. It covers both manual calculations and using SPSS software to analyze the data. The script explains the process of inputting variables, running the test, interpreting t-values, and comparing them to critical values. In the case study, the calculated t-value (0.417) was smaller than the critical value (1.833), leading to the acceptance of the null hypothesis. The conclusion is that the training did not effectively improve the participants' knowledge. Viewers are invited to ask questions in the comments.
Takeaways
- 😀 The paired sample t-test is used to compare the means of two related groups, such as 'before' and 'after' scenarios.
- 😀 The formula for the t-test is based on the difference between the two sample means, the standard deviation, and the number of observations.
- 😀 A key step in conducting the t-test manually is to calculate the t-value and compare it with the t-table value to decide whether to accept or reject the null hypothesis.
- 😀 In the given example, the t-value (0.417) was smaller than the critical t-value (1.833), meaning the null hypothesis was accepted.
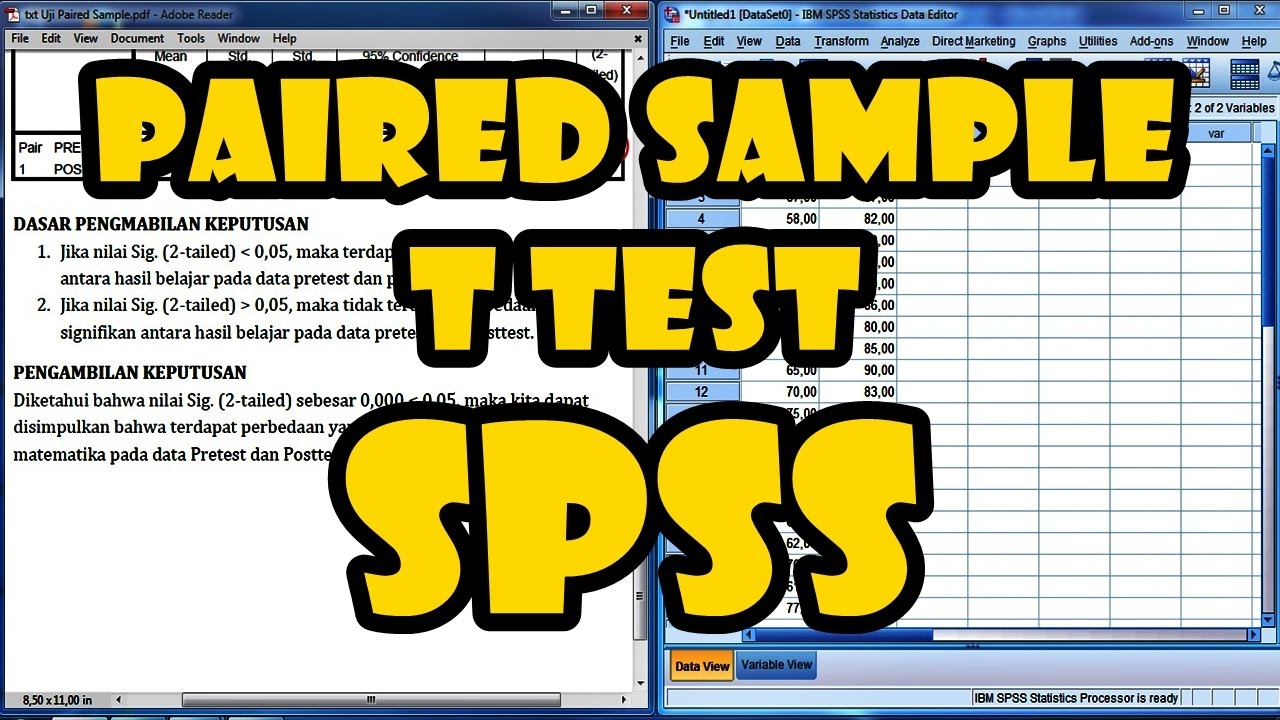
- 😀 SPSS provides a more streamlined way to perform the paired sample t-test, where data can be inputted easily and results are generated automatically.
- 😀 In SPSS, after inputting the 'before' and 'after' data, the analysis menu is used to select the paired sample t-test option.
- 😀 The SPSS output provides descriptive statistics such as mean and standard deviation, as well as the t-value and p-value for hypothesis testing.
- 😀 The correlation between the 'before' and 'after' data was very weak (0.13), indicating a negligible relationship between the two variables.
- 😀 In the SPSS output, the mean difference (d̄) between the two groups was 0.6, with a t-value of 0.417, which was consistent with the manual calculation.
- 😀 The p-value (0.687) was larger than the alpha value (0.05), meaning the null hypothesis (H₀) was accepted, concluding that the training did not effectively improve knowledge.
Q & A
What is the purpose of a paired sample t-test?
-The purpose of a paired sample t-test is to compare the means of two related groups to determine if there is a statistically significant difference between them.
How do you calculate the t-value manually in a paired sample t-test?
-To calculate the t-value manually in a paired sample t-test, you subtract the before value from the after value for each pair, calculate the mean of these differences, then divide the mean by the standard error of the differences.
What is the significance of the t-table in hypothesis testing?
-The t-table provides critical values for the t-distribution, which are used to determine whether the calculated t-value is statistically significant. The critical value depends on the sample size and the chosen significance level (alpha).
How do you interpret the results of the t-test in terms of the null hypothesis?
-If the calculated t-value (t-hitung) is greater than the critical value (t-tabel), the null hypothesis (H0) is rejected. If the t-hitung is smaller, H0 is accepted, indicating no significant difference between the groups.
What role does the p-value (V-value) play in hypothesis testing?
-The p-value is used to determine the significance of the results. If the p-value is smaller than the chosen alpha (typically 0.05), the null hypothesis is rejected. If the p-value is larger, the null hypothesis is accepted.
What does it mean when the p-value is greater than the alpha value?
-When the p-value is greater than the alpha value, it suggests that the results are not statistically significant, and the null hypothesis is accepted.
Why is it important to input the correct order of variables in SPSS?
-Inputting the correct order of variables in SPSS is crucial because it affects the calculation of the t-value and the interpretation of the results. If the variables are swapped, the signs of the t-value may be incorrect, leading to an incorrect conclusion.
What is the relationship between the 'before' and 'after' variables in the paired sample t-test?
-The 'before' and 'after' variables represent two related measurements from the same subjects. The paired sample t-test analyzes the difference between these measurements to determine if there is a significant change.
What does a correlation of 0.13 between the 'before' and 'after' variables indicate?
-A correlation of 0.13 indicates a very weak relationship between the 'before' and 'after' variables. In this case, the relationship is not significant enough to suggest a strong connection.
How does the conclusion from the paired sample t-test affect the decision about the effectiveness of the training program?
-The conclusion from the paired sample t-test, where H0 is accepted, suggests that the training program was not effective in improving the knowledge about the mission and vision, as there was no statistically significant difference between the 'before' and 'after' measurements.
Outlines

此内容仅限付费用户访问。 请升级后访问。
立即升级Mindmap

此内容仅限付费用户访问。 请升级后访问。
立即升级Keywords

此内容仅限付费用户访问。 请升级后访问。
立即升级Highlights

此内容仅限付费用户访问。 请升级后访问。
立即升级Transcripts

此内容仅限付费用户访问。 请升级后访问。
立即升级浏览更多相关视频


5.0 / 5 (0 votes)
