Gambarlah grafik himpunan penyelesaian dari sistem pertidaksamaan berikut dengan x dan y e R. 2x+...
Summary
TLDRIn this video, the presenter explains how to graph solutions for a system of inequalities. They begin by solving the inequalities 2x + y = 6 and x + 3y = 9, finding the intersection points with the x- and y-axes. The graphing process involves marking points (3, 0) and (0, 6) for the first inequality, and (9, 0) and (0, 3) for the second. The presenter also discusses determining the feasible region based on the inequalities' signs, with areas under the lines for less than or equal signs. The video concludes with the final solution region for the system.
Takeaways
- 😀 To solve the system of inequalities, start by finding the intercepts of each equation.
- 😀 The x-intercept for the equation 2x + y = 6 is found by setting y = 0, giving the point (3, 0).
- 😀 The y-intercept for the equation 2x + y = 6 is found by setting x = 0, giving the point (0, 6).
- 😀 After plotting the intercepts for 2x + y = 6, draw a solid line as the inequality includes 'less than or equal to'.
- 😀 The x-intercept for the equation x + 3y = 9 is found by setting y = 0, giving the point (9, 0).
- 😀 The y-intercept for the equation x + 3y = 9 is found by setting x = 0, giving the point (0, 3).
- 😀 After plotting the intercepts for x + 3y = 9, draw a solid line as the inequality includes 'less than or equal to'.
- 😀 For inequalities with 'less than or equal to', shade the region below the line to indicate the solution set.
- 😀 The solution region for the system of inequalities lies below both lines, in the area where the shaded regions overlap.
- 😀 Additional inequalities x ≥ 0 and y ≥ 0 restrict the solution region to the first quadrant, to the right of the y-axis and above the x-axis.
Q & A
What is the first step in solving the inequality 2x + y = 6?
-The first step is to find the x- and y-intercepts by substituting y = 0 to find the x-intercept, and x = 0 to find the y-intercept.
What are the coordinates of the x- and y-intercepts for the equation 2x + y = 6?
-The x-intercept is (3, 0), and the y-intercept is (0, 6).
How do you graph the line represented by the equation 2x + y = 6?
-To graph the line, plot the points (3, 0) and (0, 6), and then draw a straight line through these points using a solid line because the inequality sign is 'greater than or equal to' or 'less than or equal to'.
What is the next equation to be solved after 2x + y = 6?
-The next equation is x + 3y = 9.
What are the coordinates of the x- and y-intercepts for the equation x + 3y = 9?
-The x-intercept is (9, 0), and the y-intercept is (0, 3).
How do you graph the line represented by the equation x + 3y = 9?
-To graph the line, plot the points (9, 0) and (0, 3), then draw a solid line through these points, since the inequality includes 'greater than or equal to' or 'less than or equal to'.
What determines whether the region is above or below a line in graphing inequalities?
-The inequality sign determines the region. If the inequality is 'less than or equal to', the region will be below the line. If the inequality is 'greater than or equal to', the region will be above the line.
In the system of inequalities, which regions are shaded for 2x + y ≤ 6 and x + 3y ≤ 9?
-The regions below both lines are shaded, as both inequalities have a 'less than or equal to' sign.
What does the inequality x ≤ 0 imply in the graph?
-The inequality x ≤ 0 implies that the region is to the left of the y-axis, including the y-axis itself.
What does the inequality y ≥ 0 imply in the graph?
-The inequality y ≥ 0 implies that the region is above the x-axis, including the x-axis itself.
Outlines

此内容仅限付费用户访问。 请升级后访问。
立即升级Mindmap

此内容仅限付费用户访问。 请升级后访问。
立即升级Keywords

此内容仅限付费用户访问。 请升级后访问。
立即升级Highlights

此内容仅限付费用户访问。 请升级后访问。
立即升级Transcripts

此内容仅限付费用户访问。 请升级后访问。
立即升级浏览更多相关视频
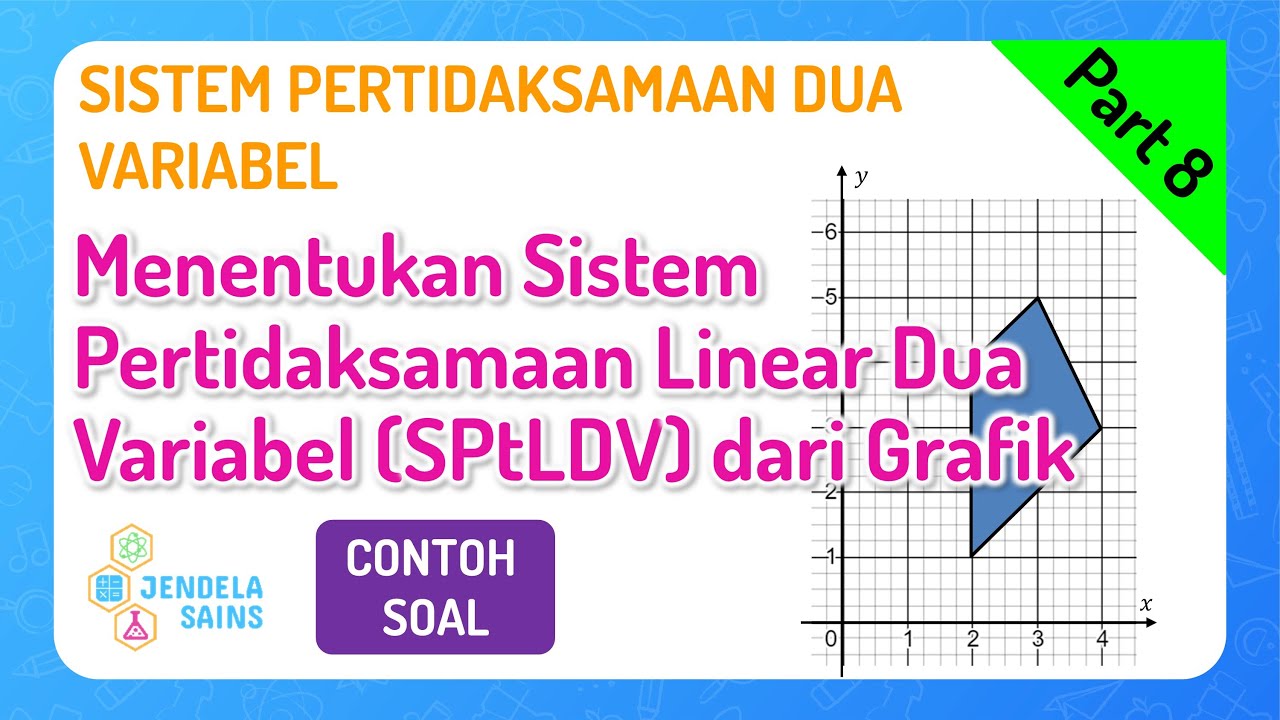
SPtDV • Part 8: Soal Menentukan Sistem Pertidaksamaan Linear Dua Variabel / SPtLDV dari Grafik (2)
Pembahasan Buku PR Matematika Kelas XB Intan Pariwara|Asesmen 2 Pilihan Ganda No.1-10|Kurmer
SPtDV Matematika Kelas 10 • Part 1: Pertidaksamaan Linear & Kuadrat Dua Variabel

Linear Programming - Graphical Solution | Don't Memorise
ILLUSTRATING LINEAR INEQUALITIES IN TWO VARIABLES || GRADE 8 MATHEMATICS Q2
Algebra 1 - Graphing Inequalities in Two Variables
5.0 / 5 (0 votes)
