Cara mudah menggambarkan grafik fungsi kuadrat
Summary
TLDRThis video tutorial from the 'Matematika Hebat' channel demonstrates how to easily graph a quadratic function. The process includes finding the x-intercepts (roots) and y-intercept, calculating the vertex and axis of symmetry, and finally drawing the graph. The equation discussed is f(x) = x² + 2x - 3. The steps are simplified and explained thoroughly, making the process accessible to viewers, and the video aims to provide clear, easy-to-follow instructions for graphing quadratic functions in a visual and engaging way.
Takeaways
- 😀 The video introduces the topic of graphing quadratic functions.
- 😀 The host encourages viewers to like, subscribe, comment, and share the video to help support the channel.
- 😀 Step 1: The first task in graphing a quadratic function is to find the x-intercepts by solving the equation for when y = 0.
- 😀 The given quadratic function is f(x) = x^2 + 2x - 3, and its x-intercepts are found by factoring the equation to give x = -3 and x = 1.
- 😀 Step 2: The y-intercept is found by setting x = 0 in the equation. The y-intercept for the given function is (0, -3).
- 😀 Step 3: The vertex of the parabola is calculated using the formula for the x-coordinate of the vertex, which is -1 for this equation.
- 😀 The y-coordinate of the vertex is found by substituting x = -1 into the original quadratic equation, yielding the vertex as (-1, -4).
- 😀 Step 4: The graph is drawn by plotting the x-intercepts, y-intercept, and vertex, and then connecting the points to form a parabola.
- 😀 The axis of symmetry for the parabola is the vertical line passing through the vertex at x = -1.
- 😀 The video concludes with a reminder of the ease of graphing quadratic functions using the steps provided, and encourages viewers to apply the method for any quadratic equation.
Q & A
What is the main topic discussed in the video?
-The video discusses the process of graphing quadratic functions, providing a step-by-step guide to drawing the graph of the quadratic function f(x) = x^2 + 2x - 3.
What is the first step in graphing a quadratic function according to the video?
-The first step is to find the x-intercepts (or roots) of the quadratic function by solving the equation f(x) = 0.
How do you determine the x-intercepts of the quadratic function?
-The x-intercepts are found by factoring the quadratic equation. In this case, the equation x^2 + 2x - 3 = 0 factors into (x + 3)(x - 1) = 0, giving the solutions x = -3 and x = 1.
What is the next step after finding the x-intercepts?
-The next step is to find the y-intercept by substituting x = 0 into the quadratic equation and solving for y.
How do you find the y-intercept of the quadratic function?
-To find the y-intercept, substitute x = 0 into the equation f(x) = x^2 + 2x - 3. This results in f(0) = 0^2 + 2(0) - 3 = -3, so the y-intercept is (0, -3).
What is the next step after finding the x- and y-intercepts?
-After finding the x- and y-intercepts, the next step is to determine the vertex and axis of symmetry of the quadratic function.
How do you calculate the vertex of the quadratic function?
-The vertex can be found using the formula for the x-coordinate of the vertex: x = -b / (2a), where 'a' and 'b' are the coefficients from the quadratic equation. In this case, for f(x) = x^2 + 2x - 3, a = 1 and b = 2, so the x-coordinate of the vertex is x = -2 / (2*1) = -1.
How do you calculate the y-coordinate of the vertex?
-The y-coordinate of the vertex is found by substituting the x-coordinate of the vertex into the original quadratic equation. For x = -1, f(-1) = (-1)^2 + 2(-1) - 3 = -4. Thus, the vertex is (-1, -4).
What is the axis of symmetry of the quadratic function?
-The axis of symmetry is a vertical line passing through the x-coordinate of the vertex. In this case, the axis of symmetry is x = -1.
How do you graph the quadratic function?
-To graph the quadratic function, plot the x- and y-intercepts, the vertex, and the axis of symmetry. Then, connect these points with a smooth curve to form the parabola.
Outlines

此内容仅限付费用户访问。 请升级后访问。
立即升级Mindmap

此内容仅限付费用户访问。 请升级后访问。
立即升级Keywords

此内容仅限付费用户访问。 请升级后访问。
立即升级Highlights

此内容仅限付费用户访问。 请升级后访问。
立即升级Transcripts

此内容仅限付费用户访问。 请升级后访问。
立即升级浏览更多相关视频
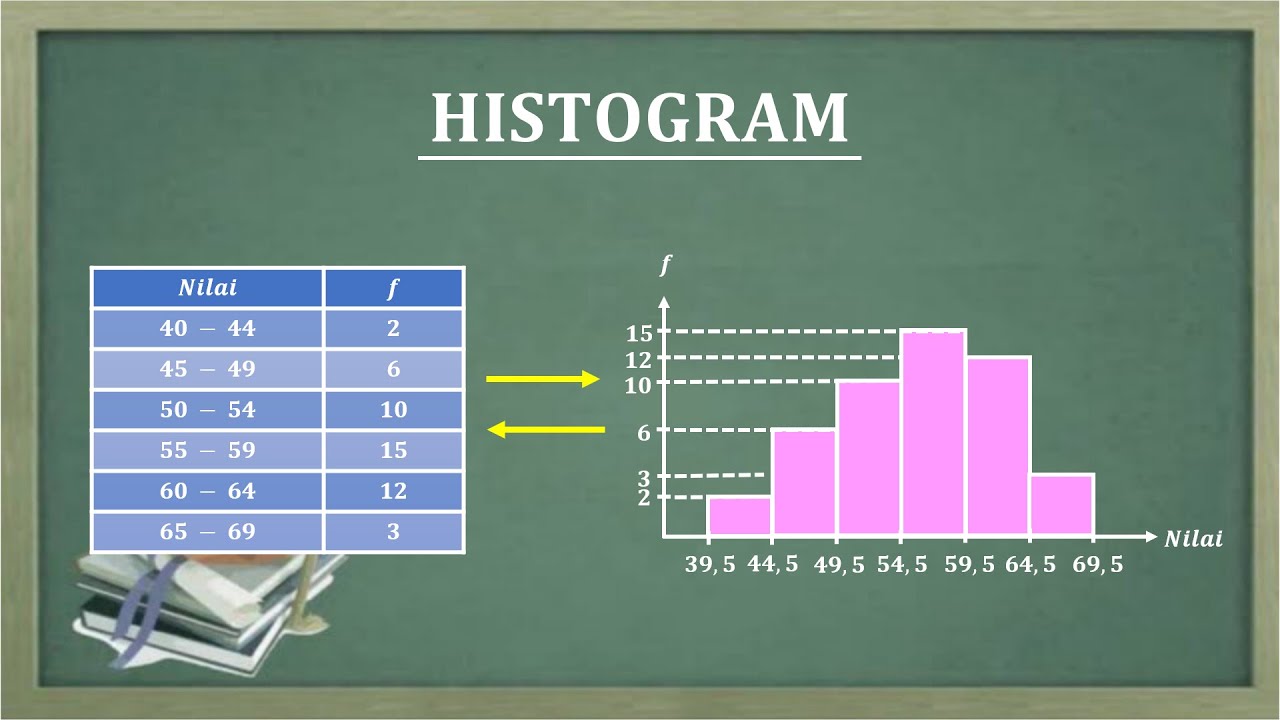
HISTOGRAM
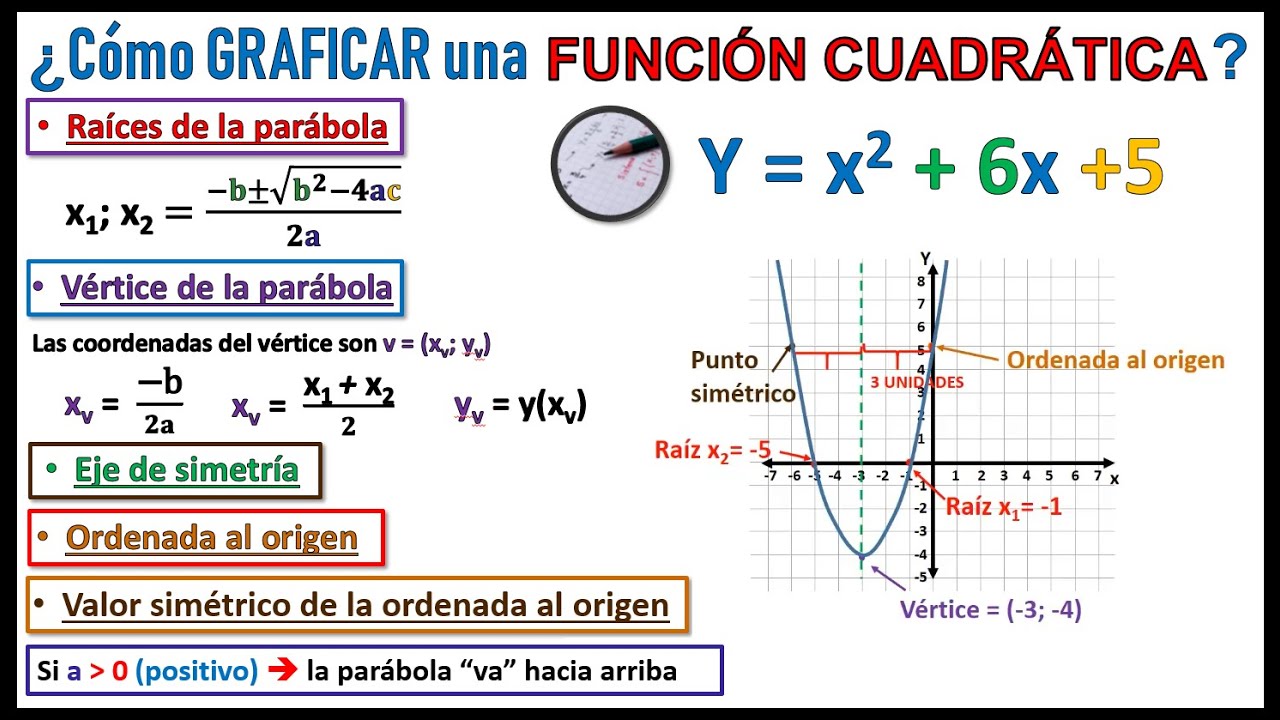
¿Cómo GRAFICAR una función CUADRÁTICA? RAÍCES, VÉRTICE, ORDENADA AL ORIGEN y MÁS

Menyusun Rumus Fungsi Kuadrat #fazanugas
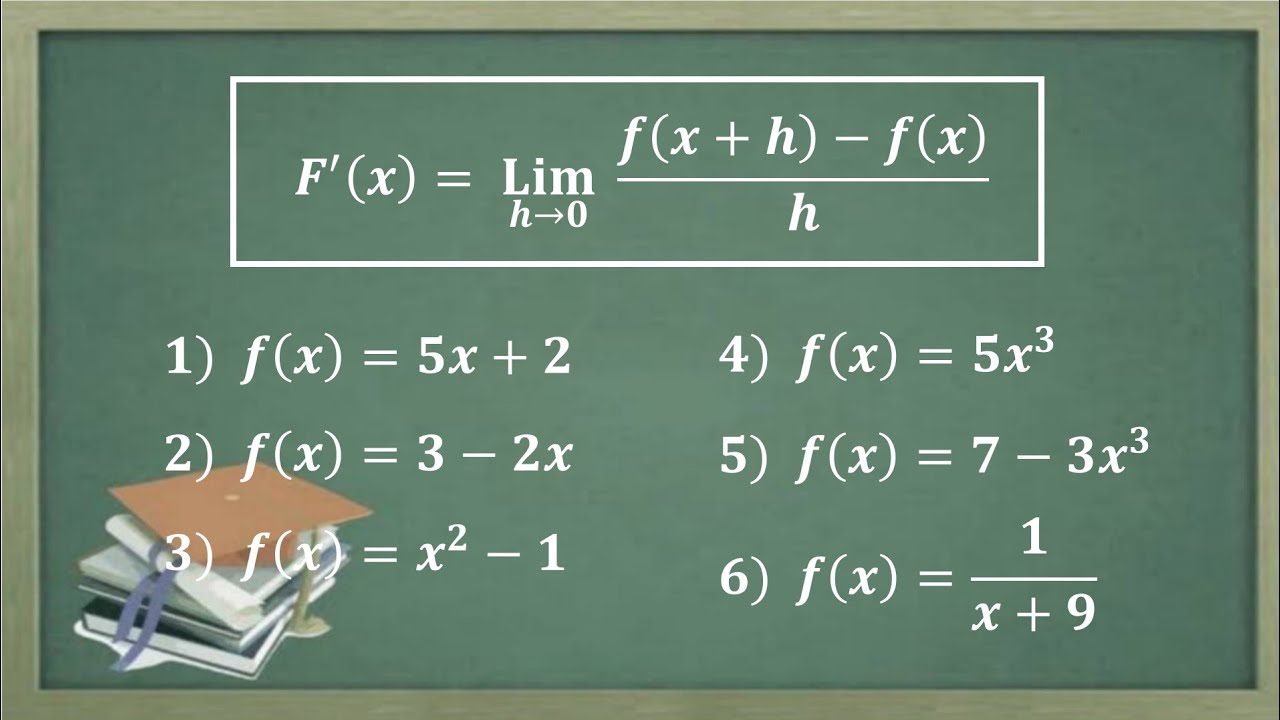
Turunan dengan menggunakan defnisi turunan Turunan menggunakan limit
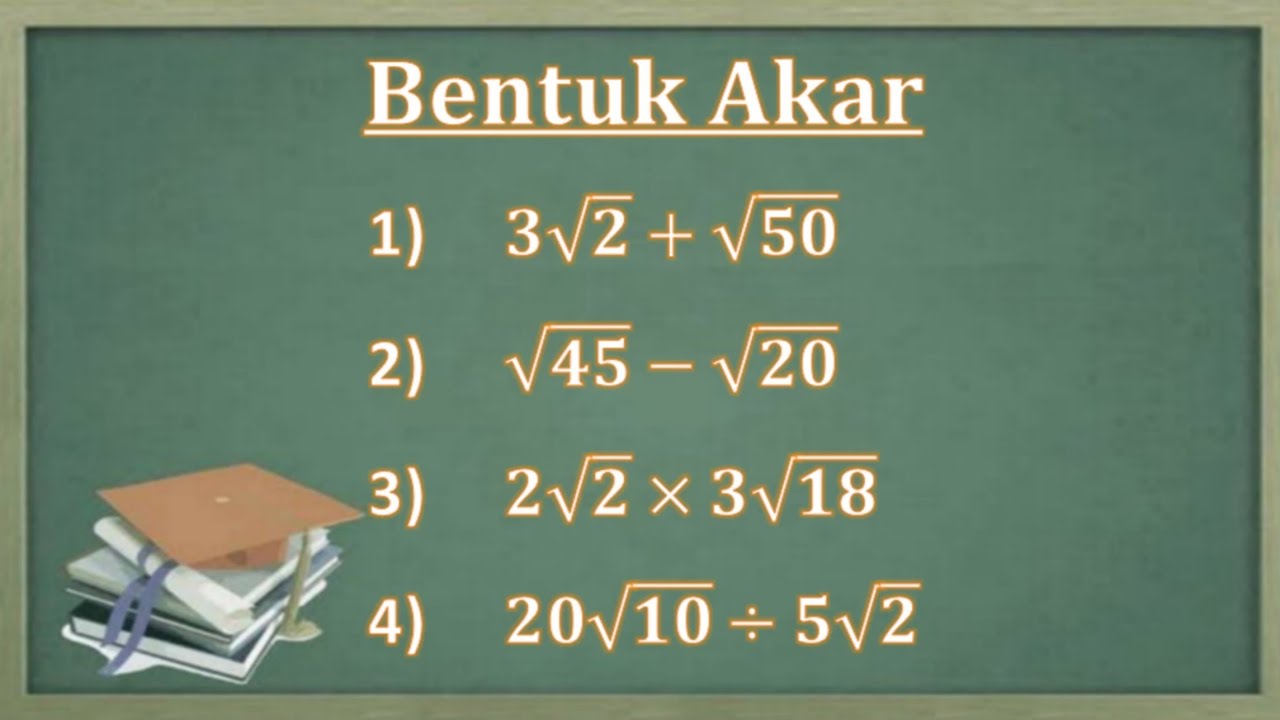
CARA MUDAH PENJUMLAHAN PENGURANGAN PERKALIAN DAN PEMBAGIAN BENTUK AKAR
Cara membuat grafik fungsi kuadrat
5.0 / 5 (0 votes)
