Pengujian Hipotesis (Seri MK Statistika)
Summary
TLDRThis video explains hypothesis testing in detail, focusing on its types (descriptive, comparative, and associative) and the steps involved in the process. It defines a hypothesis as a temporary assumption that must be tested for validity. The video provides examples for each type of hypothesis, including the study time of students. It outlines the procedure of hypothesis testing: formulating the null and alternative hypotheses, determining the significance level, selecting the test statistic, and comparing the results to critical values. The video concludes with a practical example of testing the average study time of students at Universitas Teladan.
Takeaways
- 😀 Hypothesis is a tentative statement or assumption that requires testing to confirm its validity.
- 😀 Hypotheses come in three types: descriptive, comparative, and associative.
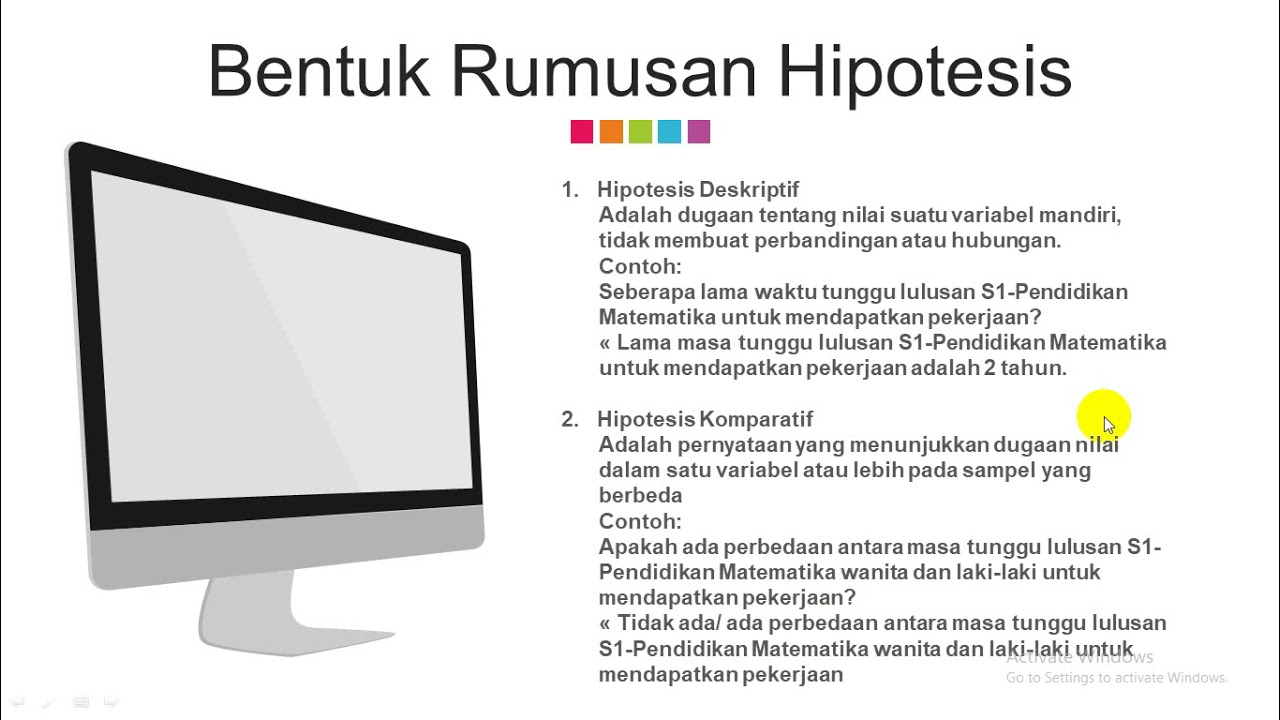
- 😀 Descriptive hypotheses focus on the value of a single variable (e.g., average study time for students).
- 😀 Comparative hypotheses compare two or more variables (e.g., comparing study time between two semesters).
- 😀 Associative hypotheses suggest a relationship between variables (e.g., study time correlates with GPA).
- 😀 Hypothesis testing follows four main steps: defining hypotheses, determining significance level, selecting a statistical test, and making conclusions.
- 😀 The null hypothesis (H0) assumes no effect or relationship, while the alternative hypothesis (H1) suggests a difference or relationship.
- 😀 The significance level (alpha) is typically set at 0.05, which represents a 5% risk of error in rejecting a true null hypothesis.
- 😀 Statistical tests, such as t-tests or z-tests, are selected based on the research question, data type, and sample size.
- 😀 One-tailed tests are used when a hypothesis specifies a direction (greater or smaller), while two-tailed tests are used when the hypothesis tests for any difference.
- 😀 The process of hypothesis testing helps determine whether the null hypothesis should be accepted or rejected based on the data gathered from samples.
Q & A
What is a hypothesis?
-A hypothesis is a provisional or temporary statement or assumption that needs testing. It is often a guess or proposition about a relationship between variables that has yet to be proven or disproven.
What are the key types of hypotheses mentioned in the video?
-The video discusses three key types of hypotheses: Descriptive, Comparative, and Associative. Descriptive hypotheses describe a variable in comparison to a constant, Comparative hypotheses compare two or more variables, and Associative hypotheses suggest a relationship between two or more variables.
How does a descriptive hypothesis differ from a comparative one?
-A descriptive hypothesis makes a claim about a single variable, usually comparing it to a fixed value, while a comparative hypothesis compares two or more variables to identify differences or relationships.
What is the role of hypothesis testing in research?
-Hypothesis testing is used to validate or reject a hypothesis through statistical methods. It involves gathering data, performing tests, and making decisions about the hypothesis, such as whether to accept or reject it based on statistical evidence.
What are the steps involved in hypothesis testing?
-The steps in hypothesis testing are: 1) Formulate the hypotheses (null and alternative). 2) Determine the significance level (alpha). 3) Calculate the test statistic. 4) Establish criteria for testing and make conclusions.
What is the null hypothesis (H₀)?
-The null hypothesis (H₀) is a statement suggesting no effect, no difference, or no relationship between variables. It is the hypothesis that researchers aim to test against the alternative hypothesis (H₁).
What does the alternative hypothesis (H₁) represent?
-The alternative hypothesis (H₁) represents a statement suggesting a significant effect, difference, or relationship between variables, contrary to what is claimed by the null hypothesis.
What is the significance level (alpha) in hypothesis testing?
-The significance level (alpha) indicates the probability of rejecting the null hypothesis when it is actually true (Type I error). Common alpha values are 0.01 (1%), 0.05 (5%), and 0.10 (10%). It helps to determine the threshold for statistical significance.
How do we determine whether to reject the null hypothesis?
-We compare the test statistic value to critical values from statistical tables (like the Z-table or T-table). If the test statistic falls outside the critical range (either less than or greater than the critical value), the null hypothesis is rejected.
In the example of PGMI students' study hours, what was the conclusion of the hypothesis test?
-In the example, the null hypothesis that the average study time is 20 hours per week was rejected based on the calculated test statistic and a 5% significance level. The data indicated that the average study time was different from 20 hours.
Outlines

此内容仅限付费用户访问。 请升级后访问。
立即升级Mindmap

此内容仅限付费用户访问。 请升级后访问。
立即升级Keywords

此内容仅限付费用户访问。 请升级后访问。
立即升级Highlights

此内容仅限付费用户访问。 请升级后访问。
立即升级Transcripts

此内容仅限付费用户访问。 请升级后访问。
立即升级浏览更多相关视频

Materi Konsep Dasar Pengujian Hipotesis
Konsep Dasar Pengujian Hipotesis

Materi 5: Hipotesis Penelitian, Pengertian dan Fungsinya #edukasi #metode #riset #peneliti #sukses

Mengenal Metode Penelitian Komparatif - Belajar Penelitian #penelitian #metodepenelitian #komparatif

A PESQUISA CIENTÍFICA: TIPOS E FASES

#8 Menyusun Hipotesis Penelitian dan Hipotesis Statistik || Penelitian Kuantitatif
5.0 / 5 (0 votes)
