PENYELESAIAN SOAL PENGUJIAN HIPOTESIS OLEH JUMALIA
Summary
TLDRIn this video, Jumalia presents a detailed explanation of hypothesis testing to evaluate a company's claim about a weight loss program. The company asserts that participants will lose 1 kg in two weeks, but the sample data shows an average loss of 0.8 kg. Jumalia walks through the process of hypothesis testing, including formulating null and alternative hypotheses, determining the significance level, calculating the test statistic, and comparing it with critical values. The conclusion rejects the company's claim, as the observed weight loss is significantly less than the claimed 1 kg.
Takeaways
- 😀 The video discusses a hypothesis testing problem related to weight loss in a two-week program.
- 😀 The company claims that participants will lose 1 kg, but the average weight loss was 0.8 kg based on data from 100 people.
- 😀 The hypothesis test aims to determine if the company's claim that the weight loss equals 1 kg is valid.
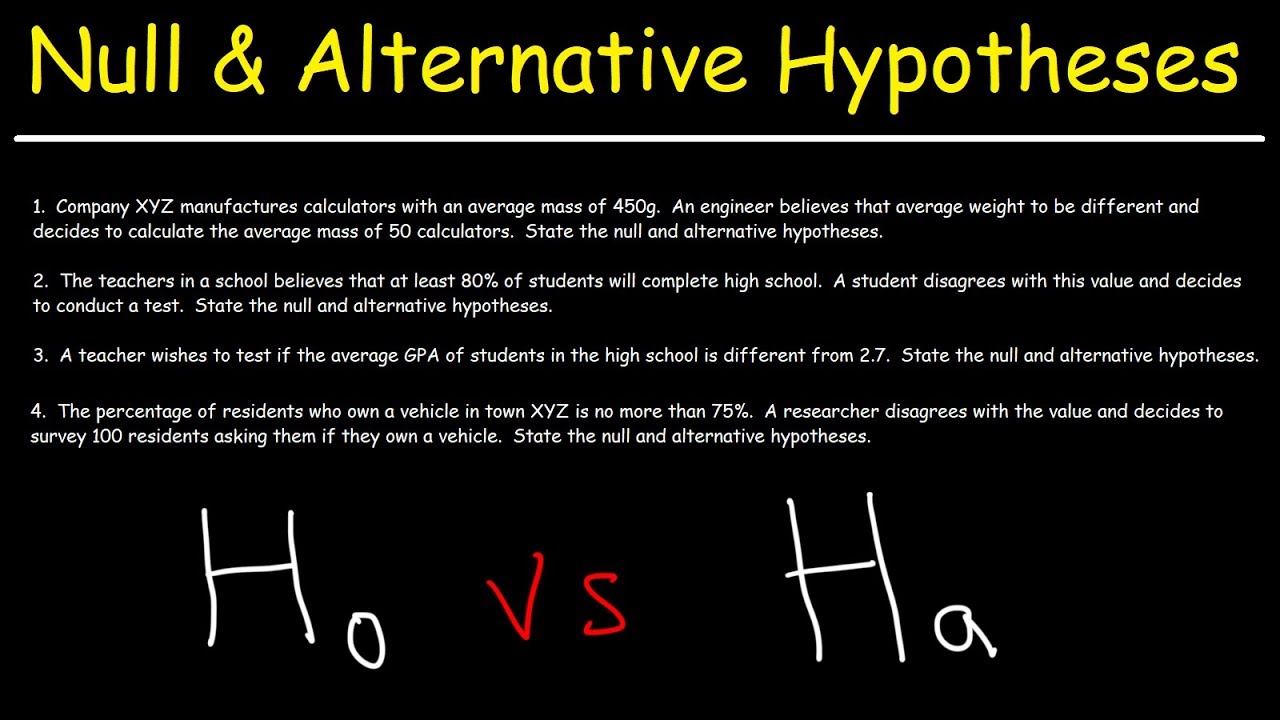
- 😀 The null hypothesis (H0) states that the average weight loss is equal to 1 kg, while the alternative hypothesis (H1) states it is not equal to 1 kg.
- 😀 The significance level (alpha) for the test is 5%, so alpha equals 0.05, and the test is two-tailed.
- 😀 For a two-tailed test, alpha is split into two, so the critical value is found for alpha/2 = 0.025.
- 😀 The Z critical value corresponding to a probability of 0.475 is 1.96, as determined from the standard normal distribution table.
- 😀 The test statistic is calculated using the formula: Z = (sample mean - population mean) / standard error.
- 😀 Standard error (SE) is calculated as the standard deviation (0.23) divided by the square root of the sample size (100), which gives 0.023.
- 😀 The Z value calculated from the formula is -8.7, which falls into the rejection region, meaning the null hypothesis is rejected.
- 😀 The conclusion is that the company's claim that participants will lose 1 kg is not supported by the data, as the actual average weight loss is less than 1 kg.
Q & A
What is the hypothesis being tested in this scenario?
-The null hypothesis (H0) is that the average weight loss is 1 kg, and the alternative hypothesis (H1) is that the average weight loss is not equal to 1 kg.
What is the significance level (alpha) used for this hypothesis test?
-The significance level is 5%, or 0.05, which indicates that the probability of making a Type I error is 5%.
Why is this a two-tailed test?
-This is a two-tailed test because the alternative hypothesis states that the weight loss could be either greater than or less than 1 kg, not just one direction.
What is the critical value for the Z test in this case?
-The critical value for the Z test is 1.96, which corresponds to the two-tailed test at a 5% significance level.
How is the standard error of the sample calculated?
-The standard error is calculated by dividing the sample's standard deviation (0.23 kg) by the square root of the sample size (100). This results in a standard error of 0.023.
What is the formula for calculating the Z statistic in this hypothesis test?
-The Z statistic is calculated using the formula: Z = (sample mean - population mean) / standard error.
What is the calculated Z statistic for this problem?
-The calculated Z statistic is -8.7, which is obtained by substituting the sample mean (0.8 kg), population mean (1 kg), and the standard error (0.023).
What is the decision rule for this hypothesis test?
-The decision rule is to reject the null hypothesis if the calculated Z statistic is less than -1.96 or greater than 1.96, meaning it falls outside the range of -1.96 to 1.96.
What conclusion is drawn from this hypothesis test?
-The null hypothesis is rejected because the calculated Z statistic (-8.7) falls outside the acceptance range of -1.96 to 1.96, indicating that the company's claim is not supported by the sample data.
What does the rejection of the null hypothesis imply about the company's claim?
-The rejection of the null hypothesis implies that the company's claim that customers will lose 1 kg over two weeks is not supported by the data, as the average weight loss is statistically different from 1 kg.
Outlines

此内容仅限付费用户访问。 请升级后访问。
立即升级Mindmap

此内容仅限付费用户访问。 请升级后访问。
立即升级Keywords

此内容仅限付费用户访问。 请升级后访问。
立即升级Highlights

此内容仅限付费用户访问。 请升级后访问。
立即升级Transcripts

此内容仅限付费用户访问。 请升级后访问。
立即升级浏览更多相关视频
Hypothesis Testing - Null and Alternative Hypotheses

Identifying Appropriate Rejection Region for a given Level of Significance

NULL AND ALTERNATIVE HYPOTHESES || HYPOTHESIS TESTING || STATISTICS AND PROBABILITY Q4
Hypothesis testing, Business Statistics and Analytics, business statistics and analytics aktu notes

Metode Statistika | Uji Hipotesis bagi Rata-rata Satu Populasi

Hipotesis
5.0 / 5 (0 votes)
