Hypothesis Testing - Null and Alternative Hypotheses
Summary
TLDRThis video script offers an introduction to hypothesis testing, focusing on formulating null and alternative hypotheses. It uses real-world examples to illustrate the process, starting with a company's calculator mass average. The script explains that the null hypothesis (H0) represents the accepted status quo, while the alternative hypothesis (Ha) is the claim that contradicts H0. Examples include testing the average mass of calculators, high school completion rates, and vehicle ownership percentages. The script emphasizes that stating hypotheses involves identifying whether the test is about a mean or a proportion, and then formulating H0 and Ha accordingly.
Takeaways
- 🔍 The video introduces the concept of hypothesis testing, focusing on how to state the null and alternative hypotheses.
- 🎯 The null hypothesis (H0) represents the status quo or the current accepted value, which is what the majority believes to be true.
- 🚀 The alternative hypothesis (Ha) is the claim that contradicts the null hypothesis, representing what the researcher is trying to prove to disprove H0.
- ✅ When stating hypotheses, it's important to determine whether you're dealing with a mean (average) or a proportion (percentage).
- 📏 The symbol for the mean is 'mu' (μ), and for a proportion, it's represented as 'p'.
- 📉 In the first example, the null hypothesis is that the average mass of calculators is 450 grams, while the alternative hypothesis is that it is different.
- 📊 For the second example, the null hypothesis is that at least 80% of students will complete high school, and the alternative is that less than 80% will.
- 📚 The third example involves a teacher testing if the average GPA is different from 2.7, with the null hypothesis being an average GPA of 2.7 and the alternative being different.
- 🏡 In the fourth example, the null hypothesis is that no more than 75% of residents own a vehicle, with the alternative hypothesis being that more than 75% do.
- 📝 Stating hypotheses doesn't require much complexity; it involves clearly articulating the current accepted value (null) and the contradictory claim (alternative).
Q & A
What is the purpose of the null hypothesis (H0) in hypothesis testing?
-The null hypothesis (H0) represents the status quo or the current accepted value that the majority of people hold to be true. It serves as a benchmark against which the alternative hypothesis is tested.
How is the alternative hypothesis (Ha) different from the null hypothesis (H0)?
-The alternative hypothesis (Ha) is contradictory to the null hypothesis (H0). It is what the researcher tries to prove in order to disprove the null hypothesis. If the researcher fails to disprove the null hypothesis, it is likely to be correct.
In the context of the video, what does the symbol 'mu' represent?
-In the video, the symbol 'mu' represents the mean of a dataset, specifically the average mass of the calculators in the example provided.
What is the null hypothesis for the calculator manufacturing company example?
-The null hypothesis for the calculator manufacturing company example is that the average mass of the calculators is 450 grams, which is represented as H0: μ = 450.
What is the alternative hypothesis for the calculator manufacturing company example?
-The alternative hypothesis for the calculator manufacturing company example is that the average mass of the calculators is different from 450 grams, represented as Ha: μ ≠ 450.
Why is it important to state both the null and alternative hypotheses before conducting a hypothesis test?
-Stating both the null and alternative hypotheses before conducting a hypothesis test is important because it sets clear expectations for the research and provides a basis for making decisions about the data collected.
In the school completion rate example, what is the null hypothesis?
-In the school completion rate example, the null hypothesis is that at least 80 percent of students will complete high school, represented as H0: p ≥ 0.80.
What is the alternative hypothesis in the school completion rate example?
-The alternative hypothesis in the school completion rate example is that less than 80 percent of students will complete high school, represented as Ha: p < 0.80.
How does the video script differentiate between a hypothesis test for a mean and a proportion?
-The video script differentiates between a hypothesis test for a mean and a proportion by using the keyword 'average' for means, represented by 'mu', and 'percentage' for proportions, which are represented as 'p'.
What is the null hypothesis for the high school GPA example in the video?
-The null hypothesis for the high school GPA example is that the average GPA of students is 2.7, represented as H0: μ = 2.7.
What is the alternative hypothesis for the high school GPA example in the video?
-The alternative hypothesis for the high school GPA example is that the average GPA of students is different from 2.7, represented as Ha: μ ≠ 2.7.
In the vehicle ownership example, what is the null hypothesis?
-In the vehicle ownership example, the null hypothesis is that the percentage of residents who own a vehicle is no more than 75 percent, represented as H0: p ≤ 0.75.
What is the alternative hypothesis for the vehicle ownership example?
-The alternative hypothesis for the vehicle ownership example is that the percentage of residents who own a vehicle is greater than 75 percent, represented as Ha: p > 0.75.
Outlines

This section is available to paid users only. Please upgrade to access this part.
Upgrade NowMindmap

This section is available to paid users only. Please upgrade to access this part.
Upgrade NowKeywords

This section is available to paid users only. Please upgrade to access this part.
Upgrade NowHighlights

This section is available to paid users only. Please upgrade to access this part.
Upgrade NowTranscripts

This section is available to paid users only. Please upgrade to access this part.
Upgrade NowBrowse More Related Video
Hypothesis Testing (Binomial) 2 • Null and Alternative Hypotheses • Stats1 Ex7A • 🤖

NULL AND ALTERNATIVE HYPOTHESES || HYPOTHESIS TESTING || STATISTICS AND PROBABILITY Q4
Hypothesis Testing and The Null Hypothesis, Clearly Explained!!!

Materi Konsep Dasar Pengujian Hipotesis
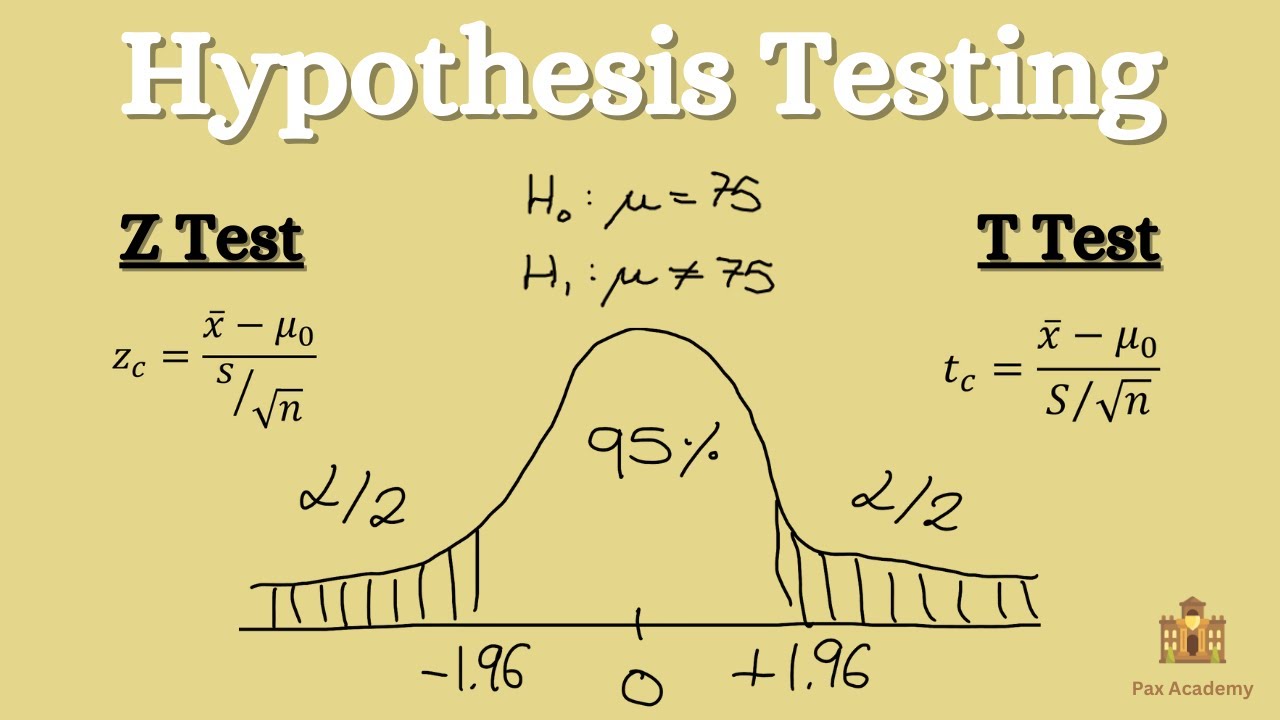
Hypothesis Testing - Z test & T test

Pengujian Hipotesis (Seri MK Statistika)
5.0 / 5 (0 votes)