VISUALISASI INFORMASI: #5 - TAHAPAN VISUALISASI INFORMASI
Summary
TLDRThis video explores effective data presentation techniques, focusing on the stages of data visualization. It covers key steps such as determining raw data sources, defining problem statements, creating cross-tabulation, and selecting the appropriate diagram type for visual communication. The video emphasizes understanding the purpose of the data, such as comparing sales or categorizing products, and choosing the correct visualization based on goals. It also highlights the importance of data storytelling, where clear titles, labels, and descriptions are necessary for impactful presentations, and provides practical guidance for converting raw data into meaningful insights.
Takeaways
- 😀 Understanding data presentation in videos is essential for clear communication of insights.
- 😀 The first step in effective data presentation is determining the data row, which acts as the foundation of the analysis.
- 😀 Clearly defining a problem statement is crucial as it guides the analysis and ensures relevance to the user's needs.
- 😀 Converting raw data into a cross-tabulation format simplifies comparison and helps identify patterns in the data.
- 😀 Choosing the right chart type is critical for effective data visualization, depending on whether you're comparing, ranking, or showing trends.
- 😀 Bar charts or column charts are ideal for comparing different categories or variables.
- 😀 Line charts are best for visualizing trends over time and understanding continuous data.
- 😀 For representing relationships or correlations between variables, scatter plots and bubble charts are highly effective.
- 😀 Pie charts and stacked bar charts are useful for showcasing part-to-whole relationships in the data.
- 😀 The process of data storytelling should include a clear title, relevant charts, well-labeled categories, and descriptive annotations to ensure the audience understands the key insights.
- 😀 A systematic approach to data presentation ensures clarity, making the data comprehensible and actionable for decision-makers.
Q & A
What is the main focus of the video?
-The main focus of the video is on data presentation techniques, specifically how to effectively visualize and present data using systematic steps and appropriate visualization principles.
What is the first stage in the data presentation process?
-The first stage is determining the data source, also known as raw data. This is crucial as it serves as the foundation for the entire data presentation process.
Why is defining a problem statement important in data presentation?
-Defining a problem statement is important because it guides the data presentation by establishing the goal or purpose. It ensures that the data is analyzed and visualized in a way that addresses the key questions or objectives.
What does converting raw data into a cross-tabulation format help achieve?
-Converting raw data into a cross-tabulation format helps organize the data in a way that makes it easier to compare, analyze, and derive insights from different categories or variables.
What types of charts are typically used for comparing data across categories?
-For comparing data across categories, bar charts and column charts are commonly used. These charts help highlight differences between categories, such as sales across different regions or products.
How are line charts useful in data presentation?
-Line charts are useful for presenting trends over time. They show how a variable changes over a period, making it easier to analyze increases, decreases, or patterns in the data over time.
What is the purpose of data storytelling in the context of data presentation?
-Data storytelling is the final stage where the data is presented clearly and meaningfully. It involves structuring the data in a way that communicates insights effectively to the audience, often using visual elements such as titles, labels, and descriptions.
What role do Gestalt principles play in data presentation?
-Gestalt principles help in emphasizing key elements of the data visualization, guiding the viewer’s focus, and ensuring the visual clarity of the most important insights in the data presentation.
What are the four main types of analysis covered in the video?
-The four main types of analysis are comparison, ranking, trend over time, and relationships. Each requires different chart types to effectively present the data.
Why is it important to choose the right chart type based on the data and goal?
-Choosing the right chart type ensures that the data is presented in the most effective way for the intended analysis. The appropriate chart type helps the audience easily interpret the data and draw meaningful conclusions.
Outlines

此内容仅限付费用户访问。 请升级后访问。
立即升级Mindmap

此内容仅限付费用户访问。 请升级后访问。
立即升级Keywords

此内容仅限付费用户访问。 请升级后访问。
立即升级Highlights

此内容仅限付费用户访问。 请升级后访问。
立即升级Transcripts

此内容仅限付费用户访问。 请升级后访问。
立即升级浏览更多相关视频
How to declutter data visualizations (5 steps)

Presentation of Data
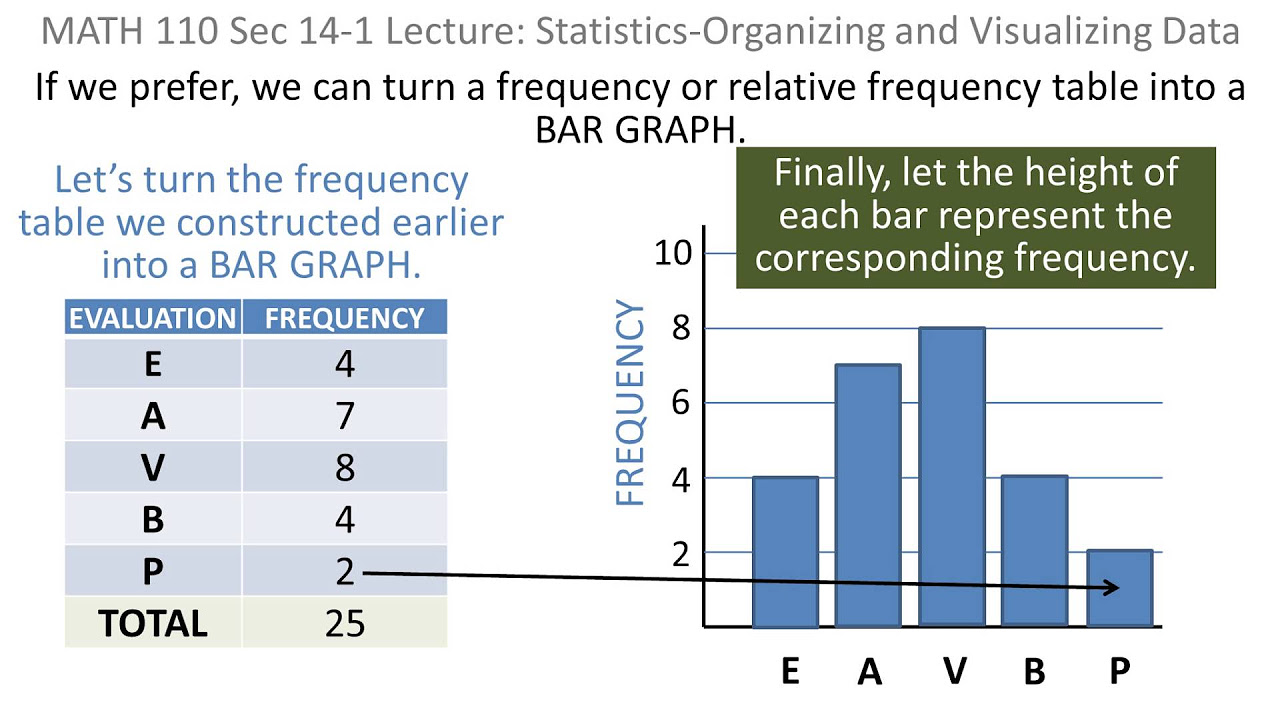
Statistics: 01 Organizing and Visaulizing Data

Business Research Methods | Graphical Representation of Data, Hypothesis| AKTU Digital Education

Data Visualization Techniques | Data Visualization Techniques and Tools | Data Visualization Trends

DataVis Contemporary Methods
5.0 / 5 (0 votes)
