How to Make a Gantt Chart in Excel
Summary
TLDRIn this video, the creator demonstrates how to build a dynamic Gantt Chart template in Excel, showcasing key features like a scroll bar and progress tracking for tasks. The tutorial covers step-by-step instructions, from setting up the basic task list with start and end dates to applying conditional formatting for progress bars. It also includes tips for customizing the chart’s date range, making the timeline start on Monday, and creating an interactive display using a scroll bar. Additionally, the video touches on formatting, adding labels, and adjusting print settings for optimal presentation.
Takeaways
- 😀 Use Excel's custom number format to display just the day of the month for your Gantt chart timeline.
- 😀 Merge cells to show the full date and create a dynamic chart that updates when the project start date changes.
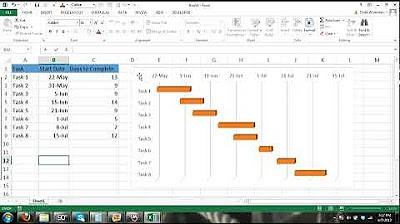
- 😀 Apply conditional formatting to automatically shade cells in the Gantt chart when dates fall within the start and end dates of tasks.
- 😀 To create a scrolling Gantt chart, use a scrollbar control linked to a cell that adjusts the displayed week.
- 😀 Ensure the timeline always starts on Monday by adjusting the formula with the WEEKDAY function.
- 😀 Turn off gridlines for a cleaner chart presentation and adjust font sizes and vertical alignment for readability.
- 😀 Use conditional formatting for progress bars in the 'Percent Complete' column to visually represent task progress.
- 😀 Utilize named ranges to make formulas more readable and manageable when calculating task start, end, and progress.
- 😀 Adjust print settings to fit the Gantt chart on one page in landscape orientation, excluding the scrollbar from the printout.
- 😀 Add a line to mark today's date in the Gantt chart using conditional formatting and a comparison formula to the TODAY function.
- 😀 Make the chart more interactive by using a scroll bar to control which week of the Gantt chart is displayed, creating a dynamic visual tool.
Q & A
What is the first step in creating the Gantt Chart template?
-The first step is to create a list of tasks with their corresponding start and end dates, and then adjust the column widths to make the data visually manageable.
Why is it important to display only the day of the month in the Gantt Chart?
-Displaying only the day of the month helps keep the chart clean and focused, allowing for an easy overview of dates while retaining the full date in the background for calculations.
How does the formula work to dynamically update the timeline when the project start date changes?
-The formula adds one day to each subsequent date based on the project start date, ensuring that the chart adjusts automatically whenever the start date is modified.
What is the purpose of turning off the gridlines and formatting the table headers with a dark background?
-Turning off the gridlines and using dark background headers enhances the readability of the Gantt Chart, making it visually appealing and easier to follow.
How does conditional formatting help in creating the Gantt Chart's task bars?
-Conditional formatting shades the cells where the date at the top of the column falls between the start and end dates, automatically filling in the task bars based on the project's timeline.
Why is the Gantt Chart timeline designed to always start on a Monday?
-By subtracting the weekday value from the project start date, the formula ensures that the timeline begins on a Monday, regardless of when the project itself starts.
How does the scroll bar functionality work in the Gantt Chart?
-The scroll bar allows users to navigate through the timeline by adjusting the display week. When the value of the display week changes, the dates in the chart update accordingly, creating a scrollable Gantt Chart.
What is the significance of the 'today's date' marker in the Gantt Chart?
-The 'today's date' marker is added using conditional formatting, making it easy to visually track the current day on the Gantt Chart with a red border.
How are progress bars implemented within the task columns of the Gantt Chart?
-Progress bars are created using conditional formatting with data bars, which are set to display a range from 0 to 100% based on the task's progress value, providing a visual representation of task completion.
What are the final steps in preparing the Gantt Chart for printing?
-The final steps include adjusting the page layout for landscape orientation, setting the margins, scaling to fit the chart on one page, and ensuring that the scroll bar and other objects are not printed.
Outlines

此内容仅限付费用户访问。 请升级后访问。
立即升级Mindmap

此内容仅限付费用户访问。 请升级后访问。
立即升级Keywords

此内容仅限付费用户访问。 请升级后访问。
立即升级Highlights

此内容仅限付费用户访问。 请升级后访问。
立即升级Transcripts

此内容仅限付费用户访问。 请升级后访问。
立即升级5.0 / 5 (0 votes)


