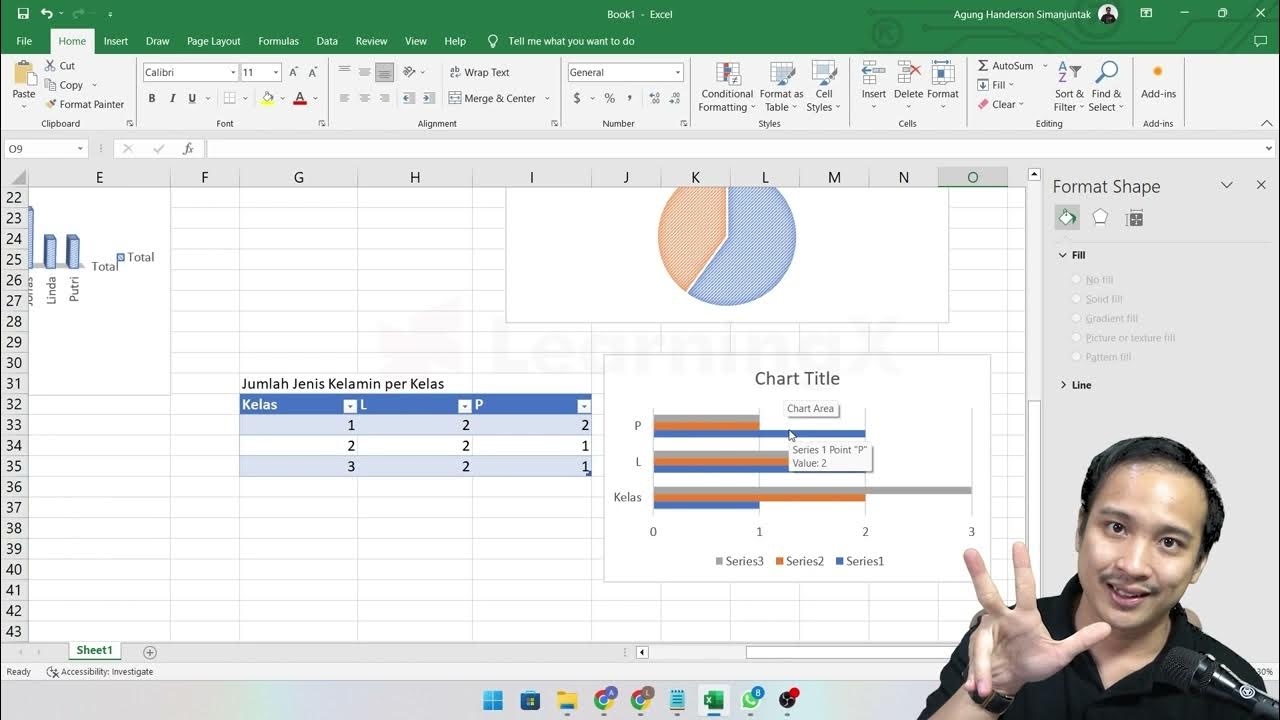
Excel Pivot Table EXPLAINED in 10 Minutes (Productivity tips included!)
Summary
TLDRThis video introduces Excel Pivot Tables, highlighting their ability to quickly analyze data and generate reports without complex formulas. It guides viewers through the process of organizing data, creating Pivot Tables, and customizing them for insights on sales by product and customer. The video covers essential features like value field settings, formatting, sorting, and adding slicers for interactive filtering. Emphasizing efficiency, the tutorial concludes by showcasing how to refresh Pivot Tables to include new data, underscoring the speed and ease of using Pivot Tables for data analysis.
Takeaways
- 😀 Pivot Tables are essential for quickly extracting insights from data and generating reports.
- 😀 Organize your data in a tabular format with headers and no empty rows or columns before creating a Pivot Table.
- 😀 Converting your data range into an official Excel table allows Pivot Tables to automatically include new data.
- 😀 Recommended Pivot Tables can provide smart suggestions based on your data layout.
- 😀 Right-clicking on a Pivot Table gives you options to change calculations, such as switching from sum to average.
- 😀 You can customize the number format in Pivot Tables, including adding a 1000 separator for clarity.
- 😀 Filters, columns, and rows can be easily adjusted in a Pivot Table to analyze data from different perspectives.
- 😀 Slicers can enhance user interaction by providing buttons for filtering Pivot Table data easily.
- 😀 To keep Pivot Tables updated with new data, simply right-click and select 'Refresh.'
- 😀 Pivot Tables simplify data analysis without the need for complex formulas, making them a powerful tool for data management.
Q & A
What is the primary purpose of using Excel Pivot Tables?
-The primary purpose of using Excel Pivot Tables is to gain insights from data and create reports quickly and efficiently.
What preliminary step must be taken before inserting a Pivot Table?
-Before inserting a Pivot Table, ensure that your data is organized in a proper tabular format, with headers for each column and no empty columns or rows.
How can you convert your data set into an official Excel table?
-You can convert your data set into an official Excel table by selecting the data and using the shortcut key Ctrl+T, which allows Excel to recognize it has headers.
What happens when you convert your data into a table before creating a Pivot Table?
-When you convert your data into a table, any new data added will automatically be included in the Pivot Table when you refresh it.
What are Recommended PivotTables, and how can they assist users?
-Recommended PivotTables are suggested by Excel based on the data set, providing a quick start for users by offering pre-built configurations that may meet their reporting needs.
How can you change the summary function of a value in a Pivot Table?
-To change the summary function of a value in a Pivot Table, right-click the value, select 'Value Field Settings,' and choose the desired summary function, such as average or sum.
What options are available for formatting numbers in a Pivot Table?
-You can format numbers in a Pivot Table by right-clicking the value and selecting 'Number Format' to apply settings like adding a thousand separator.
How can you filter data in a Pivot Table using Slicers?
-You can filter data in a Pivot Table using Slicers by right-clicking on a field in the field list and selecting 'Add a Slicer,' allowing for easy visual filtering of data.
What is the significance of using the 'Show Values As' feature?
-The 'Show Values As' feature allows users to display values in different contexts, such as percentages of a grand total, enhancing the understanding of the data.
How do you ensure that all Pivot Tables update together when new data is added?
-To ensure all Pivot Tables update together when new data is added, you should refresh any Pivot Table, as they share the same pivot cache, allowing them to reflect the latest data.
Outlines

此内容仅限付费用户访问。 请升级后访问。
立即升级Mindmap

此内容仅限付费用户访问。 请升级后访问。
立即升级Keywords

此内容仅限付费用户访问。 请升级后访问。
立即升级Highlights

此内容仅限付费用户访问。 请升级后访问。
立即升级Transcripts

此内容仅限付费用户访问。 请升级后访问。
立即升级浏览更多相关视频

Tabelle Pivot - EXCEL TUTORIAL ITALIANO 50

The AI Spreadsheet We've All Been Waiting For

pivot table for beginners in excel in Hindi | pivot table excel in hindi

6 Massively time saving Pivot Table tricks (Don't miss #4 & #6) ⏰

Learn Excel Pivot Tables in 10 Minutes - A complete beginner's tutorial

Chapter 5 - Analisa Data melalui Excel | Informatika Booster
5.0 / 5 (0 votes)
