Introduction to Simple Linear Regression
Summary
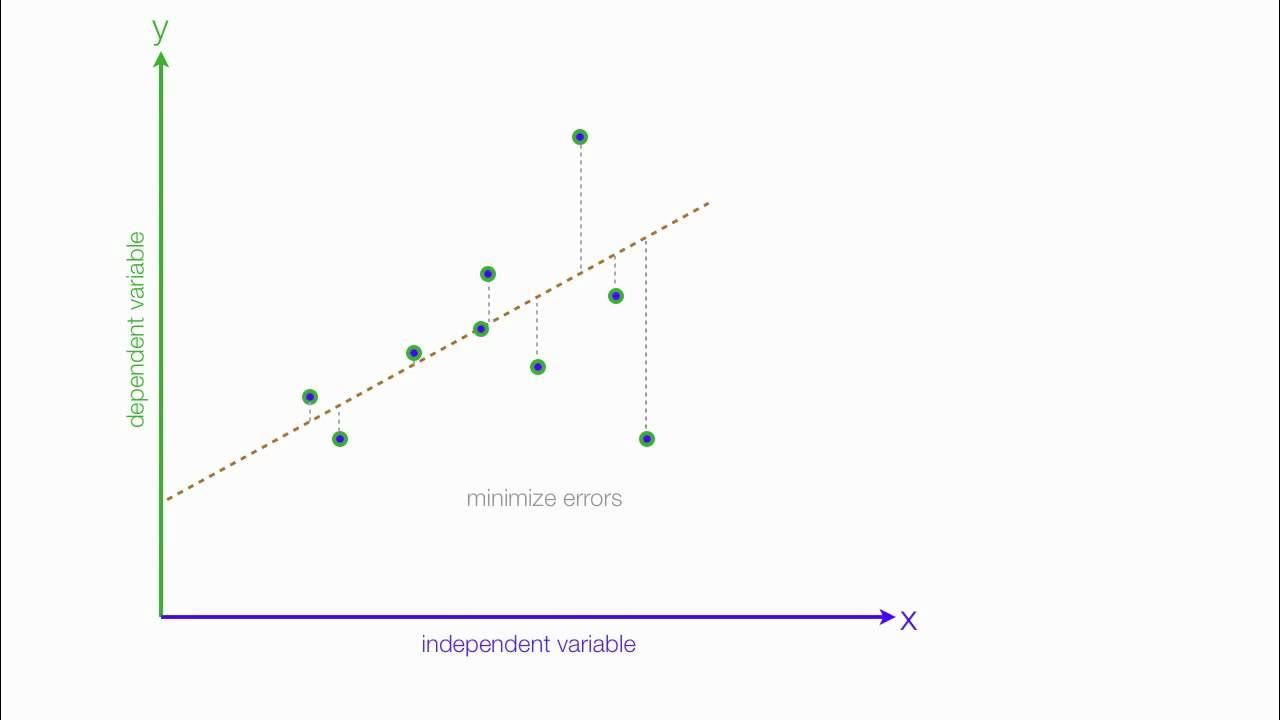
TLDRThis video introduces simple linear regression, explaining how it examines the relationship between a response variable (Y) and an explanatory variable (X). The concept is demonstrated through examples, such as using the density of Australian timber to predict its Janka hardness, and exploring the relationship between empathy scores and pain-related brain activity. The video also touches on the use of least squares to estimate regression parameters, emphasizing the idea of fitting a line through data points to predict outcomes. The role of error and variability in observed values is also discussed.
Takeaways
- 📊 Regression analysis explores the relationship between a quantitative response variable (Y) and explanatory variables (X).
- ➕ Simple linear regression involves one explanatory variable, while multiple regression uses more than one.
- 🌳 Example: Using the density of Australian timber (X) to predict its Janka hardness (Y).
- 📉 The explanatory variable (X) predicts the response variable (Y), with X as density and Y as hardness in the timber example.
- 📈 The first step in regression is plotting data to visualize the relationship between the variables.
- 🔍 Researchers also study the relationship between empathic concern scores (X) and brain activity during pain (Y) in 16 females.
- 💡 The goal is to determine if there is strong evidence of a relationship between X and Y or measure the strength of that relationship.
- 📐 A linear relationship between X and Y is often assumed, with the line representing the true mean of Y for given X values.
- 🧮 Observed values of Y do not fall exactly on the line due to random variability, represented by the error term Epsilon.
- 🛠 Beta 0 and Beta 1 are the unknown parameters for the intercept and slope of the line, which are estimated using the method of least squares.
Q & A
What is the main purpose of regression analysis?
-Regression analysis explores the relationship between a quantitative response variable and one or more explanatory variables. It helps predict the value of a response variable based on the value(s) of the explanatory variable(s).
What is the difference between simple linear regression and multiple regression?
-Simple linear regression involves one explanatory variable, while multiple regression involves more than one explanatory variable to predict the response variable.
What is an example of a simple linear regression problem presented in the script?
-An example is using the density of Australian Timber to predict its Janka hardness. Density is the explanatory variable (X), and hardness is the response variable (Y).
Why might density be used to predict Janka hardness in the timber example?
-Density is easier to measure than Janka hardness, which requires more effort. Establishing a relationship between density and hardness allows the easier-to-measure variable (density) to be used for prediction.
What is meant by 'explanatory variable' and 'response variable'?
-The explanatory variable, also known as the independent variable (X), is the one used to make predictions. The response variable, or dependent variable (Y), is the one being predicted.
What is the purpose of plotting data in a simple linear regression analysis?
-Plotting the data helps visualize the relationship between the explanatory and response variables. It allows us to see whether a linear relationship exists and whether it might be appropriate to use a line for prediction.
What key questions should be asked when fitting a line in simple linear regression?
-Key questions include: How do we determine a good-fitting line? Is a line a reasonable summary of the relationship? Is the relationship strong enough for prediction purposes?
What is the significance of the 'true mean' in a simple linear regression model?
-The 'true mean' of Y for a given value of X represents the theoretical average value of the response variable for that particular value of the explanatory variable. This is represented by the line in a linear regression model.
What role does the random error component (Epsilon) play in the regression model?
-The random error component (Epsilon) accounts for the variability in the observed values of the response variable (Y) around the regression line. It reflects that the actual values of Y do not fall exactly on the predicted line due to random variation.
What method is typically used to estimate the parameters in a linear regression model?
-The method of least squares is commonly used to estimate the parameters in a linear regression model. It minimizes the sum of squared differences between observed and predicted values of Y.
Outlines

此内容仅限付费用户访问。 请升级后访问。
立即升级Mindmap

此内容仅限付费用户访问。 请升级后访问。
立即升级Keywords

此内容仅限付费用户访问。 请升级后访问。
立即升级Highlights

此内容仅限付费用户访问。 请升级后访问。
立即升级Transcripts

此内容仅限付费用户访问。 请升级后访问。
立即升级浏览更多相关视频

35. Regressione Lineare Semplice (Spiegata passo dopo passo)

[Mathematics in the Modern World] Correlation & Simple Linear Regression

Regression and R-Squared (2.2)

Simple Linear Regression Simplified | Orange Data Mining Tutorial

An Introduction to Linear Regression Analysis

Simple Linear Regression: An Easy and Clear Beginner’s Guide
5.0 / 5 (0 votes)
