An Introduction to Linear Regression Analysis

statisticsfun
5 Feb 201205:18

Summary

TLDRThis tutorial introduces the concept of linear regression, where a straight line is used to model the relationship between an independent variable (X) and a dependent variable (Y). It explains the positive and negative relationships between variables, such as study time and grades, or time spent on Facebook and grades, respectively. The tutorial covers the least squares method for fitting the regression line, aiming to minimize errors between estimated and actual values. It also touches on the development of the regression equation, involving the y-intercept (B naught) and slope (B 1), which will be further elaborated in subsequent videos.

Takeaways

  • 📈 The tutorial introduces the concept of regression analysis involving an X (independent) variable and a Y (dependent) variable.
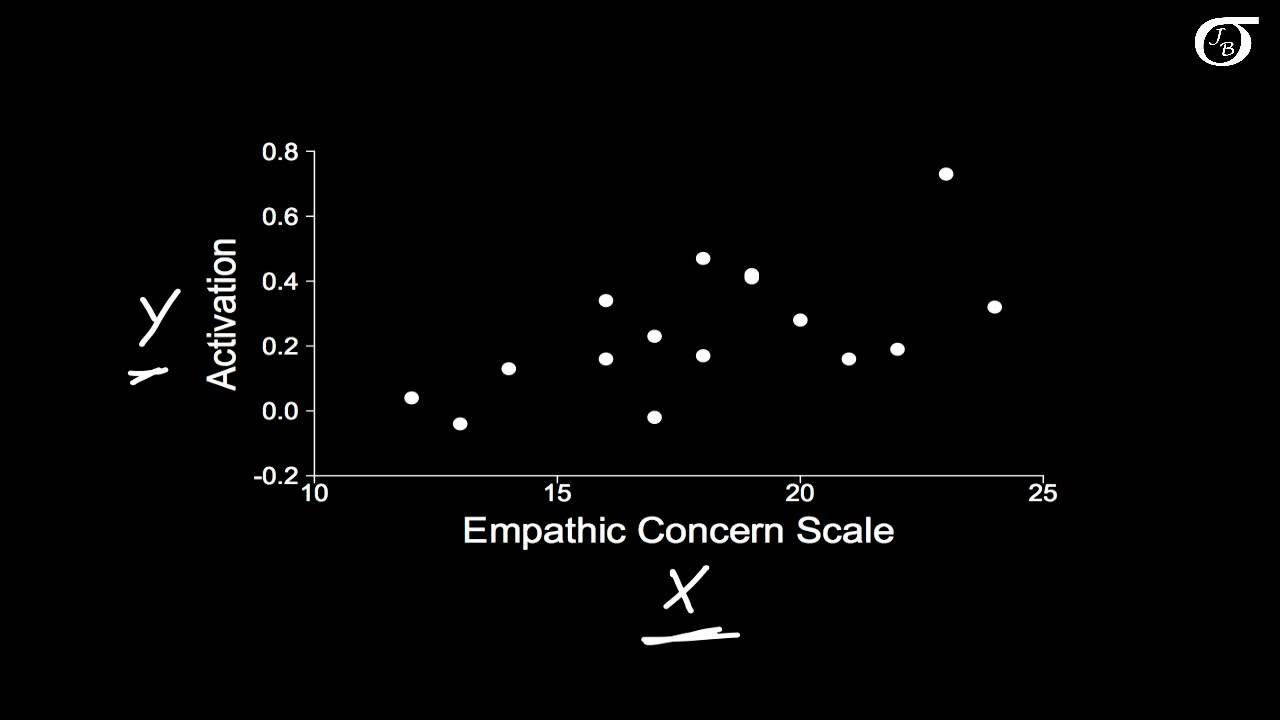
  • 📊 The X variable is placed on the x-axis, and the Y variable is on the y-axis, aiming to establish a relationship between them.
  • 🔍 The tutorial discusses how changes in the independent variable affect the dependent variable, indicating whether they move in the same or opposite directions.
  • ➡️ A positive relationship is identified when both variables increase together, while a negative relationship is when one increases as the other decreases.
  • 📐 Linear regression involves fitting a straight line to the data points, which represents the relationship between the variables.
  • 🔧 The least squares method is used to determine the best-fit line that minimizes the difference between estimated and actual values.
  • 📉 The goal of regression is to minimize errors, aiming for the smallest possible discrepancies between predictions and observations.
  • 🧠 The script mentions an example where study time (independent) is related to grades (dependent), indicating a positive relationship.
  • 📚 Another example given is time spent on Facebook (independent) negatively affecting grades (dependent), illustrating a negative relationship.
  • 📝 The regression equation is introduced as "\( \hat{y} = b_0 + b_1 \times X \)", where \( b_0 \) is the y-intercept and \( b_1 \) is the slope of the line.
  • 🔬 The tutorial promises to explain in later videos how to derive the coefficients \( b_0 \) and \( b_1 \) mathematically.

Q & A

  • What is the main focus of this tutorial?

    -The tutorial focuses on an introduction to regression, explaining the relationship between independent (X) and dependent (Y) variables.

  • What are the two types of variables typically involved in regression analysis?

    -The two types of variables are the independent variable (X), which is on the x-axis, and the dependent variable (Y), which is on the y-axis.

  • What does it mean if the independent variable increases and the dependent variable also increases?

    -If the independent variable increases and the dependent variable increases as well, there is a positive relationship between them.

  • What is the term used to describe the scenario where an increase in the independent variable leads to a decrease in the dependent variable?

    -This scenario is described as a negative relationship.

  • What is the goal of linear regression?

    -The goal of linear regression is to find a straight line that best fits the data points, minimizing the difference between the estimated and actual values.

  • What method is commonly used to determine the best-fitting line in linear regression?

    -The least squares method is commonly used to determine the best-fitting line in linear regression.

  • What is the purpose of the regression line in the context of the tutorial?

    -The regression line is used to estimate the dependent variable's value based on the independent variable, with the aim of minimizing errors.

  • What does 'y hat' represent in the context of the tutorial?

    -'y hat' represents the estimated value of the dependent variable in the regression equation.

  • What are 'B naught' and 'B 1' in the regression equation, and what do they represent?

    -'B naught' is the y-intercept of the regression line, and 'B 1' is the slope of the line, representing the rate of change of the dependent variable with respect to the independent variable.

  • How does the tutorial illustrate the relationship between study time and grades?

    -The tutorial illustrates a positive relationship between study time and grades, suggesting that as study time increases, grades should also go up.

  • What is the relationship between time spent on Facebook and grades according to the tutorial?

    -The tutorial suggests a negative relationship between time spent on Facebook and grades, indicating that more time on Facebook could lead to lower grades.

  • What is the role of the independent variable in the context of regression?

    -The independent variable is what is controlled, manipulated, or changed in an experiment or study to observe its effect on the dependent variable.

  • How does the tutorial plan to simplify the understanding of regression equations?

    -The tutorial plans to step through the process in a step-by-step manner in the next video, aiming to make the concept of regression equations simple and clear.

Outlines

00:00

📊 Introduction to Regression Analysis

This paragraph introduces the concept of regression analysis, focusing on the relationship between an independent variable (X) and a dependent variable (Y). It explains the process of drawing a straight line, known as the regression line, to model this relationship. The tutorial outlines the importance of understanding whether variables move in the same direction (positive relationship) or opposite directions (negative relationship). The method of least squares is mentioned as a technique to fit the line and minimize the error between estimated and actual values. An example is given where study time (independent) is related to grades or GPA (dependent), illustrating a positive relationship.

05:02

🔍 Further Exploration of Regression Concepts

The second paragraph promises a deeper dive into the topic of regression analysis in the next video. It suggests that the process will be broken down step by step to simplify the understanding of the subject. Although the content of the next video is not detailed here, the paragraph serves as a transition and a teaser for further exploration of the concepts introduced in the first paragraph.

Mindmap

Keywords

💡Regression

Regression refers to a set of statistical methods used to understand the relationship between variables. In the context of the video, it specifically addresses how to model the relationship between an independent variable (e.g., study time) and a dependent variable (e.g., grades). The main theme revolves around identifying whether changes in the independent variable lead to corresponding changes in the dependent variable, either positively or negatively.

💡Independent Variable

An independent variable is the variable that is manipulated or changed in an experiment to determine its effect on another variable. In the video, 'study time' and 'time on Facebook' are examples of independent variables. The script discusses how changes in these variables can affect the dependent variable, illustrating the core concept of regression analysis.

💡Dependent Variable

A dependent variable is the outcome or result that is being measured in an experiment. It is 'dependent' on the independent variable. In the script, 'grades' or 'GPA' are the dependent variables, which are expected to change based on the amount of 'study time' or 'time on Facebook', highlighting the cause-and-effect relationship central to regression.

💡Positive Relationship

A positive relationship indicates that as one variable increases, the other variable also increases. The script uses 'study time' and 'grades' to illustrate this concept, suggesting that more study time should lead to higher grades, a fundamental principle in understanding linear regression.

💡Negative Relationship

A negative relationship occurs when one variable increases while the other decreases. The video script mentions 'time on Facebook' and 'grades' to demonstrate this, where more time spent on Facebook is associated with lower grades, showing the inverse relationship in regression analysis.

💡Linear Regression

Linear regression is a statistical method used to model the relationship between a dependent variable and one or more independent variables by fitting a linear equation to observed data. The video emphasizes the fitting of a straight line, which represents the best estimate of the relationship between variables based on the least squares method.

💡Least Squares Method

The least squares method is a standard approach in regression analysis to find the best-fitting line through a set of data points. The script explains that this method minimizes the sum of the squares of the vertical distances (errors) between the observed values and the values predicted by the line, which is key to creating an accurate regression model.

💡Y-intercept (B naught)

The y-intercept, denoted as 'B naught' in the script, is the point where the line crosses the y-axis in a linear regression model. It represents the estimated value of the dependent variable when the independent variable is zero. The script uses 'B naught' to illustrate the starting point of the regression line in the context of estimating grades based on study time or time on Facebook.

💡Slope (B 1)

The slope, represented as 'B 1' in the script, is a measure of the steepness of a line and indicates the rate of change between the dependent and independent variables. A positive slope, as in the case of study time and grades, suggests that as study time increases, grades also increase. Conversely, a negative slope, as with time on Facebook and grades, indicates that as time on Facebook increases, grades decrease.

💡Error Minimization

Error minimization is the process of reducing the differences between the actual observed values and the values estimated by a model. In the video, the goal of regression is to find a line that minimizes these errors, ensuring that the model provides the most accurate predictions possible. This concept is central to understanding the effectiveness of a regression model.

💡Observations

Observations are the individual data points collected during an experiment or study. In the context of the video, observations are plotted on a graph to visualize the relationship between variables. The script mentions plotting observations to find a regression line that best fits the data, which is a fundamental step in conducting a regression analysis.

Highlights

Introduction to regression with X and Y variables representing independent and dependent variables.

Explaining the concept of forming a relationship between variables and visualizing it with a straight line.

Describing the process of understanding the direction of change in dependent variables relative to independent variables.

Identifying positive and negative relationships between variables based on their directional movements.

The importance of the straight line in linear regression and its role in minimizing error.

The least squares method as the foundation for finding the regression line.

Minimizing the difference between estimated and actual values to reduce error in regression analysis.

Using study time as an independent variable and grades as a dependent variable to demonstrate a positive relationship.

The mathematical formulation of the estimated grades equation with B naught and B 1.

Transcripts

play00:00

this tutorial is an introduction to

play00:02

regression there is an X variable and a

play00:07

Y variable in this case

play00:11

the independent variables on the x-axis

play00:13

and the dependent variable is on the

play00:15

y-axis and we try to form a relationship

play00:20

between these two variables and draw a

play00:22

line in this case a straight line and

play00:25

over the next series of videos I'll

play00:28

explain what all this means what we try

play00:31

to understand is as the independent

play00:33

variable is moving or changing what

play00:37

happens to the dependent variable does

play00:40

it go up or does it go down how does it

play00:42

change

play00:44

if they move in the same direction if

play00:47

the independent variable increases and

play00:49

the dependent variable increases as well

play00:52

like this we say there's a positive

play00:55

relationship if on the other hand as the

play01:04

independent variable increases and the

play01:07

dependent variable decreases like this

play01:11

we say there's a negative relationship

play01:15

the line would look like this

play01:17

go downward in the linear regression we

play01:22

try to make a line a line to make a

play01:26

linear regression the key is on line

play01:28

right there a straight line you can also

play01:31

do curved lines but for the this topic

play01:33

is all straight lines to actually

play01:35

conduct regression I take observations

play01:37

and always plot some more observations

play01:41

in your random play I'll stick them in

play01:43

here like that and I try to find a line

play01:45

that will fit a straight line that fits

play01:47

through all these different points and

play01:50

this is called my regression line and

play01:53

it's based upon the least squares method

play01:56

and in the end I want to minimize the

play02:00

difference between the estimated value

play02:02

and the actual value I want to minimize

play02:06

my error errors this line will have a

play02:11

lot of errors if I compare the actual to

play02:14

the estimated value and again the point

play02:18

is to minimize these errors or make them

play02:20

as small as possible now let's imagine I

play02:25

put study time on the x-axis or make

play02:28

that my independent variable and the

play02:30

dependent variable becomes grades or GPA

play02:33

as study time increases grades should go

play02:37

up there is a positive relationship in

play02:43

regression we develop these equations

play02:45

like this in this case y hat is

play02:50

estimated grades and it's based upon or

play02:52

it's equal to B naught plus B 1 times

play02:57

X where X is study time be not we derive

play03:04

mathematically and it is the y-intercept

play03:12

b1 we also derive mathematically and

play03:15

I'll do in a later video and it's the

play03:17

slope of the line in this case the slope

play03:20

is positive in the next video I'll

play03:25

discuss how you develop these equations

play03:28

now if I change the x-axis to time on

play03:31

face book we see a negative relationship

play03:35

more time on face book grades will

play03:38

suffer and go down a negative

play03:41

relationship what we're estimating is

play03:44

still grades estimated grades is equal

play03:47

to B naught minus B 1 times X where X is

play03:52

time on Facebook B naught is still the y

play04:00

intercept the y-intercept and it is a

play04:09

calculated value the slope of the line

play04:13

is negative B 1 because it's downward

play04:17

sloping negative relationship and as I

play04:21

said before all show you how to

play04:22

calculate this equation in the next

play04:25

video

play04:26

the X is the independent variable the Y

play04:33

is the dependent variable the X is what

play04:36

we control what we manipulate what we

play04:38

change

play04:40

and the dependent variable is the

play04:43

outcome

play04:47

so study time is the independent

play04:51

variable is what we control and

play04:53

manipulate and your grades are dependent

play04:56

upon how much you study now this looks

play05:01

really ugly and it's what I'll talk

play05:03

about in the next video but I'll step

play05:05

you step-by-step through it and

play05:07

hopefully make it simple for you

play05:16

you

Rate This

5.0 / 5 (0 votes)

Related Tags
Linear RegressionData AnalysisVariable RelationshipPositive CorrelationNegative CorrelationLeast SquaresError MinimizationStatistical MethodPredictive ModelingRegression LineEducational Tutorial