Introduction to intercepts | Algebra I | Khan Academy
Summary
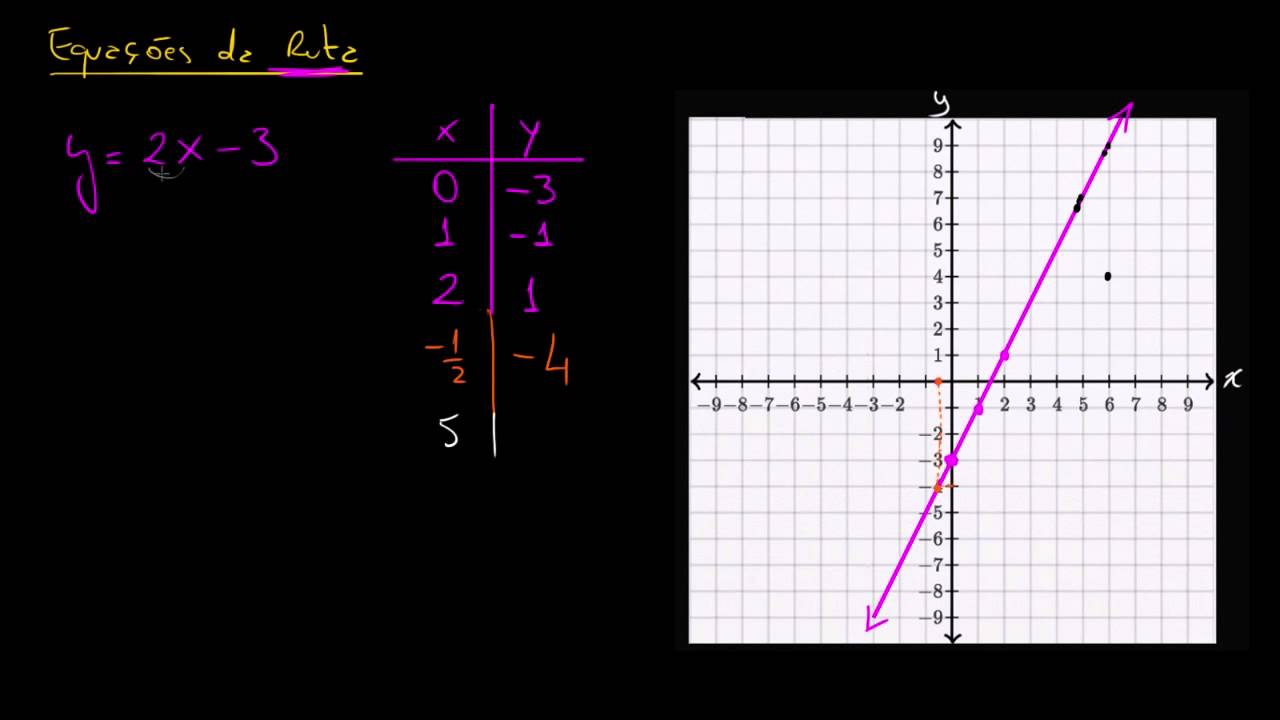
TLDRThe video explains how to graph linear equations, using the example y = 1/2x - 3. It starts by plotting points based on x values and calculating corresponding y values, then connects the points to form a line. The concepts of x-intercept and y-intercept are introduced, showing where the graph crosses the axes. Another equation, 5x + 6y = 30, is used to demonstrate finding intercepts by setting x or y to 0. The video emphasizes that x-intercepts occur when y is 0, and y-intercepts occur when x is 0.
Takeaways
- 📝 The video explains how to graph the linear equation y = 1/2x - 3 by plotting points and drawing a line.
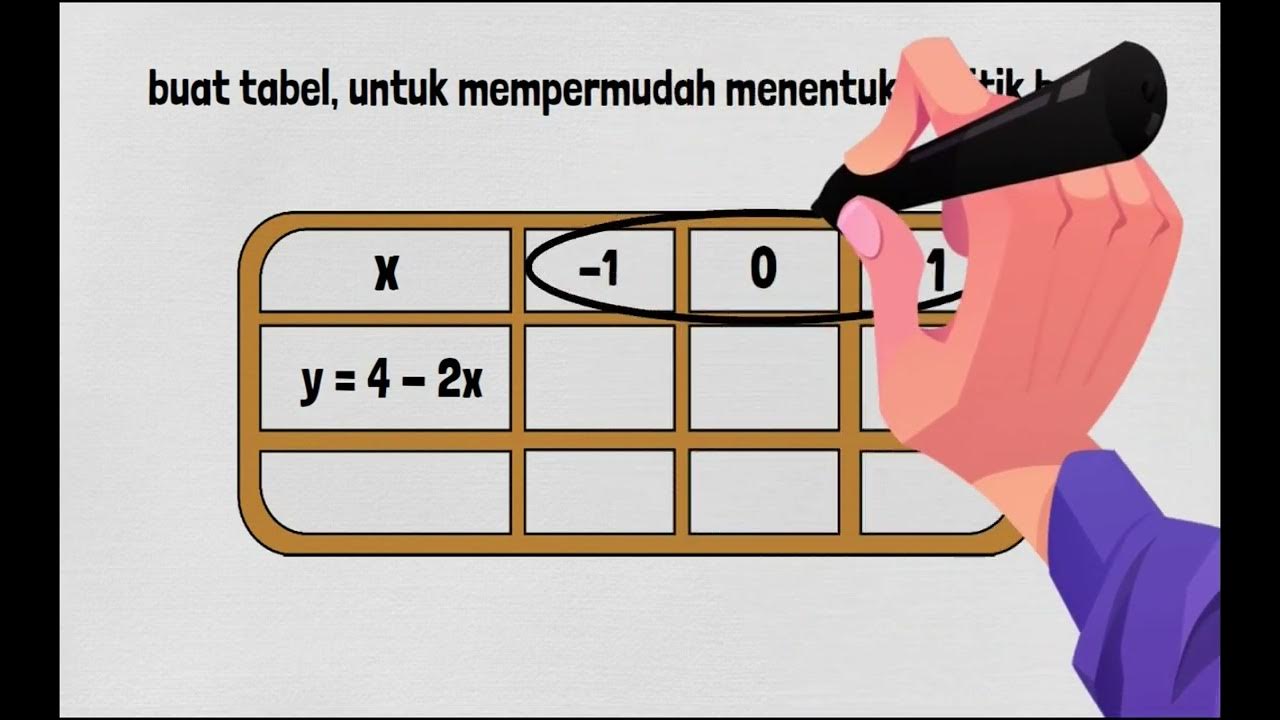
- 📊 The process begins by choosing x-values, calculating corresponding y-values, and plotting points.
- 🎯 The video emphasizes that only two points are necessary to plot a line.
- 📍 The points (0, -3), (2, -2), and (4, -1) are calculated and plotted for the equation y = 1/2x - 3.
- 🔗 A line connecting these points represents the graph of the equation y = 1/2x - 3.
- 📌 The x-intercept occurs where the line crosses the x-axis, found at (6, 0).
- 📉 The y-intercept occurs where the line crosses the y-axis, found at (0, -3).
- 🧮 To find intercepts for other equations, substitute x = 0 for the y-intercept and y = 0 for the x-intercept.
- 🔄 The video demonstrates this process with another equation, 5x + 6y = 30, showing x-intercept (6, 0) and y-intercept (0, 5).
- 💡 Intercepts help identify key points on a graph, showing where the line intersects the axes.
Q & A
What is the linear equation provided in the video?
-The linear equation is y = 1/2x - 3.
How do you find the y-value for a given x-value using this equation?
-You substitute the x-value into the equation, calculate 1/2 of that x-value, and subtract 3 to find the corresponding y-value.
What is the y-value when x = 0?
-When x = 0, the y-value is -3.
How many points are necessary to plot a straight line on a graph?
-You need at least two points to plot a straight line on a graph.
What are the points plotted on the graph for the equation y = 1/2x - 3?
-The points plotted are (0, -3), (2, -2), and (4, -1).
What is the x-intercept and how is it determined?
-The x-intercept is the point where the graph intersects the x-axis. It occurs when y = 0. In this case, the x-intercept is at the point (6, 0).
What is the y-intercept and how is it determined?
-The y-intercept is the point where the graph intersects the y-axis. It occurs when x = 0. In this case, the y-intercept is at the point (0, -3).
What does the x-intercept represent on the graph?
-The x-intercept represents the point where the line crosses the x-axis, meaning the y-value is zero.
What is the general strategy for finding x and y-intercepts for any linear equation?
-To find the y-intercept, set x = 0 and solve for y. To find the x-intercept, set y = 0 and solve for x.
What are the x and y-intercepts for the equation 5x + 6y = 30?
-The x-intercept is (6, 0) and the y-intercept is (0, 5).
Outlines

此内容仅限付费用户访问。 请升级后访问。
立即升级Mindmap

此内容仅限付费用户访问。 请升级后访问。
立即升级Keywords

此内容仅限付费用户访问。 请升级后访问。
立即升级Highlights

此内容仅限付费用户访问。 请升级后访问。
立即升级Transcripts

此内容仅限付费用户访问。 请升级后访问。
立即升级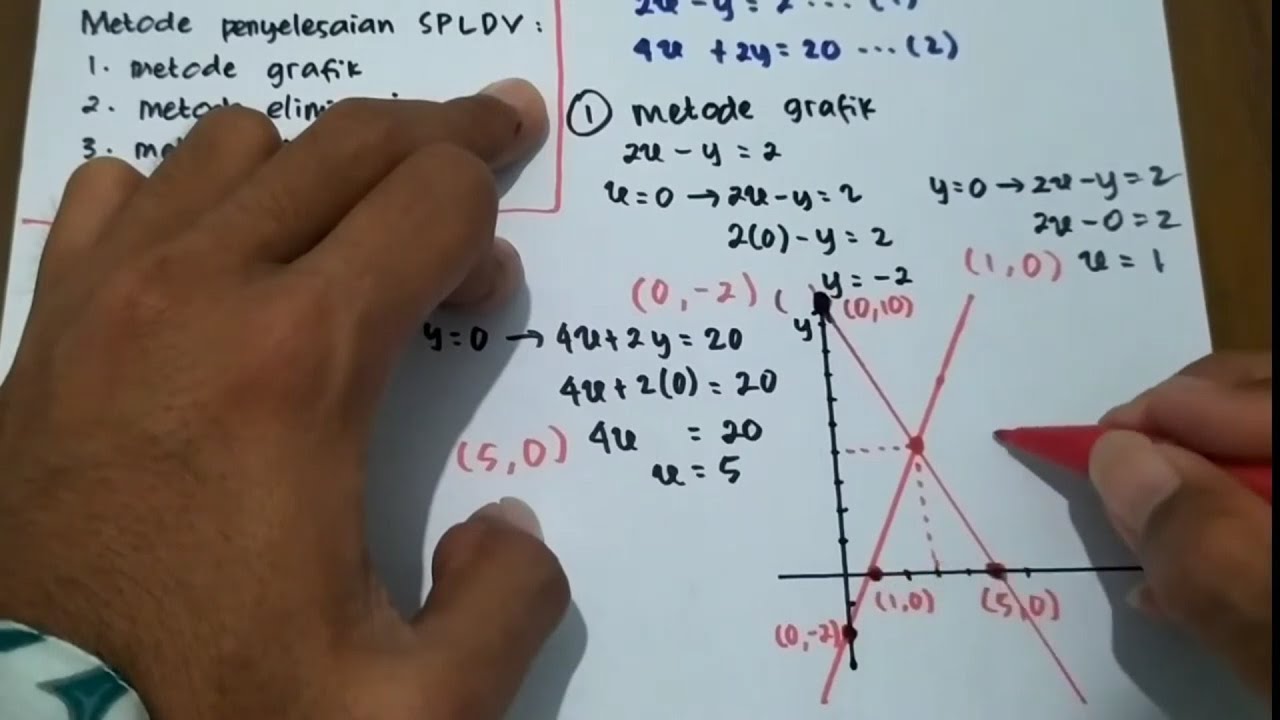

5.0 / 5 (0 votes)
