Percentiles, Quantiles and Quartiles in Statistics | Statistics Tutorial | MarinStatsLectures
Summary
TLDRThis educational video delves into the concepts of percentiles, quantiles, and quartiles, explaining their significance in data analysis. It emphasizes the median as the 50th percentile and introduces the first (25th percentile) and third (75th percentile) quartiles, highlighting their roles in dividing data into quarters. The video also touches on how percentiles can be used to interpret individual data points within a dataset. The speaker advises focusing on understanding these concepts rather than the calculation methods, which are typically handled by statistical software like R. The video concludes with a mention of other divisions like terciles, quintiles, and deciles, suggesting their utility in different analytical scenarios.
Takeaways
- 📊 Percentiles and quantiles are measures used to divide a dataset into 100 equal parts, with each part representing a percentage of the data.
- 🔄 The terms 'percentile' and 'quantile' are often used interchangeably, although there is a slight difference between them.
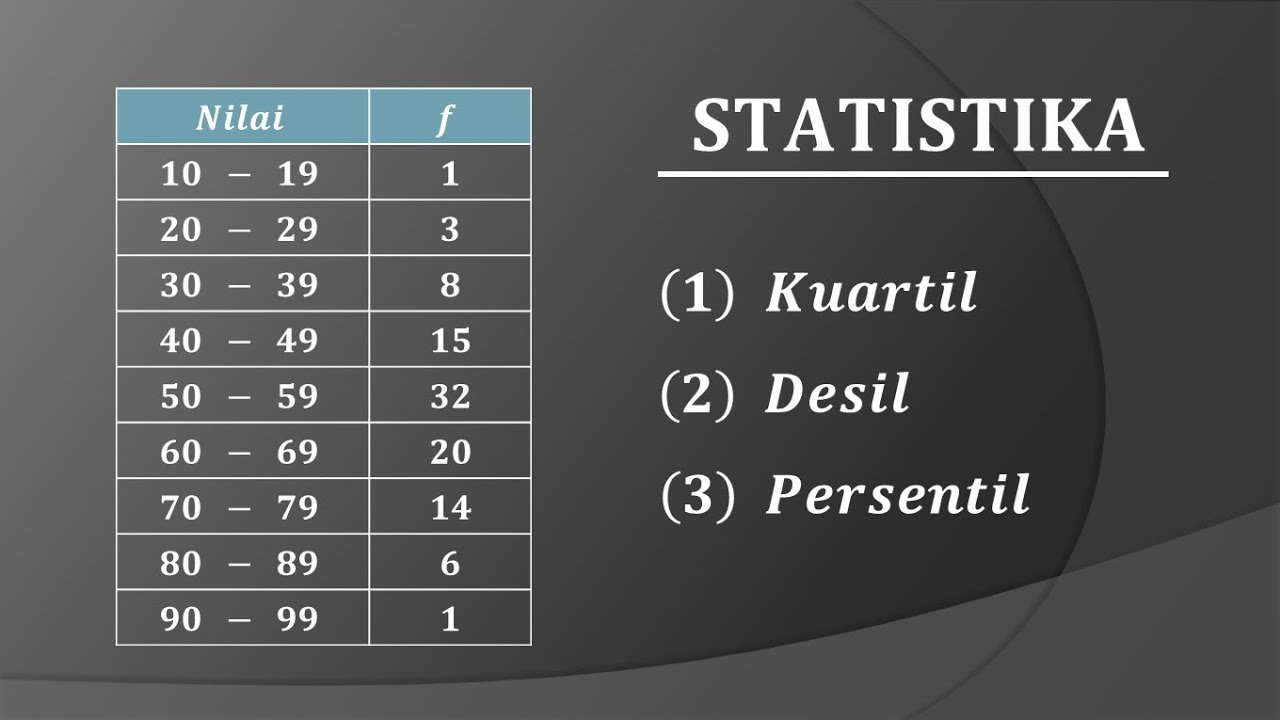
- 📈 Quartiles are specific types of percentiles or quantiles that divide the data into four equal parts, with the first quartile (Q1) representing the 25th percentile, the median (Q2) the 50th percentile, and the third quartile (Q3) the 75th percentile.
- 🎯 The median, or 50th percentile, is a special case where 50% of the data points fall below this value and 50% above.
- 📉 The first quartile (Q1) divides the dataset so that 25% of the data points are below it and 75% are above.
- 📈 The third quartile (Q3) is where 75% of the data points are below this value and 25% are above, often considered the upper quartile.
- 📊 Box plots are a graphical representation of the median, first quartile, third quartile, minimum, and maximum values of a dataset.
- 🔢 Percentiles and quantiles can be calculated for any percentage, not just the common quartiles, to provide a detailed understanding of data distribution.
- 🔄 Understanding the percentile a specific value falls into can help interpret how that value compares to the rest of the dataset.
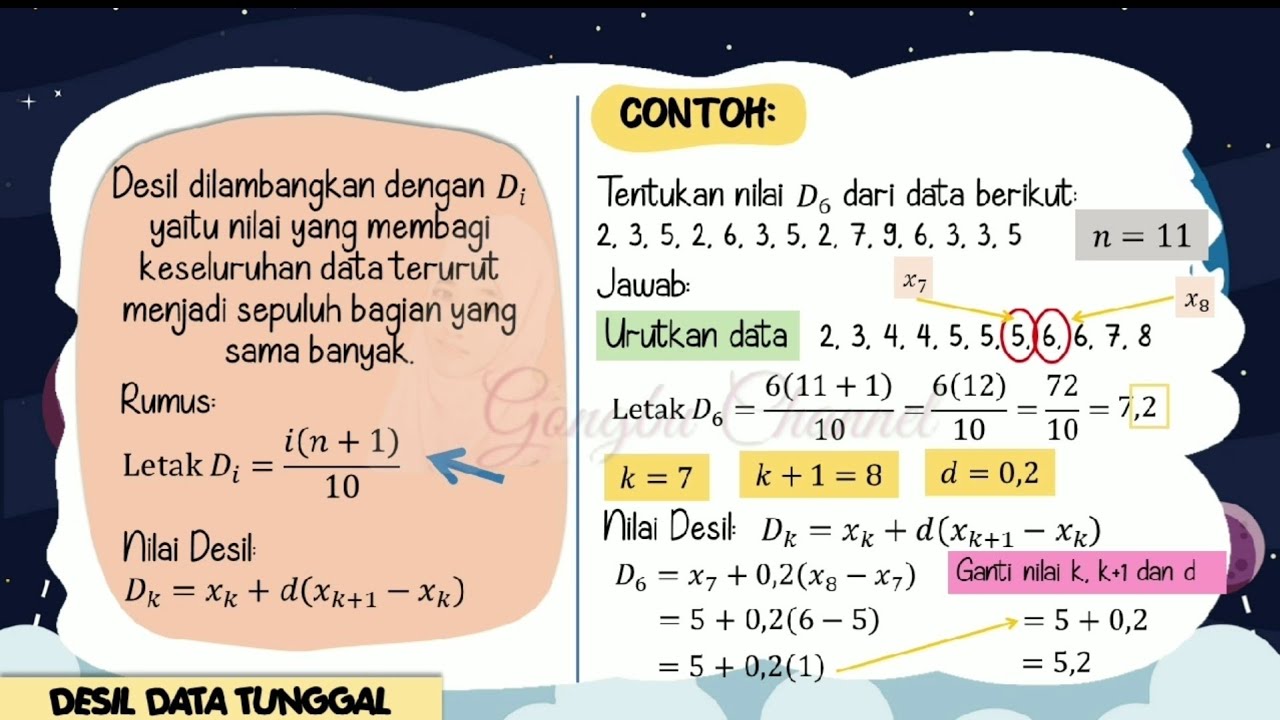
- 📊 Beyond quartiles, other divisions of data such as tertiles (thirds), quintiles (fifths), and deciles (tenths) can be used to analyze and summarize data.
Q & A
What is the difference between percentiles and quantiles?
-While there is a slight subtle difference between the two, they can be used interchangeably for the most part. Percentiles and quantiles are measures that divide a dataset into 100 equal parts, with each part representing a percentage of the dataset.
What is the median in the context of percentiles?
-The median is the 50th percentile, which means it has 50% of the ordered observations below it. It is the value that cuts the dataset in half.
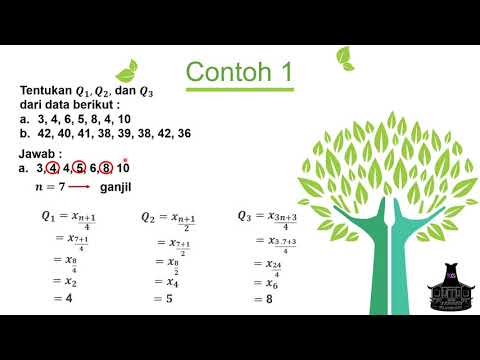
What is the first quartile (Q1) and how is it calculated?
-The first quartile, or Q1, is the 25th percentile, which has 25% of the observations below it. It divides the dataset into quarters, with one quarter below and three quarters above this value.
What does the third quartile (Q3) represent?
-The third quartile, or Q3, represents the 75th percentile, having 75% of the observations below it. It divides the dataset so that three-quarters of the data are below this value.
How are quartiles used to divide a dataset?
-Quartiles divide the dataset into four equally sized quarters. The first quartile (Q1) is the 25th percentile, the second quartile (the median) is the 50th percentile, and the third quartile (Q3) is the 75th percentile.
What is a box plot and how does it relate to quartiles?
-A box plot is a graphical visualization that displays the median, first quartile (Q1), and third quartile (Q3), as well as the minimum and maximum values of a dataset. It provides a quick summary of the data's distribution.
Can percentiles or quantiles be used to determine how an individual data point ranks within a dataset?
-Yes, percentiles or quantiles can be used to determine the rank of an individual data point within a dataset by identifying what percentage of observations fall below that specific value.
What is the purpose of calculating percentiles or quantiles?
-Percentiles and quantiles are useful for summarizing the distribution of a dataset and for comparing individual data points to the overall dataset, providing insights into the relative standing of those points.
What are some other types of divisions of a dataset besides quartiles?
-Besides quartiles, datasets can be divided into tertiles (three equal parts), quintiles (five equal parts), or deciles (ten equal parts), depending on the level of detail required for analysis.
Why might one use statistical software like R for calculating percentiles or quantiles?
-Statistical software like R is used for calculating percentiles or quantiles because it can handle the complexity and variations in calculation methods, and it can process large datasets efficiently.
Outlines
📊 Understanding Percentiles and Quartiles
This paragraph introduces the concepts of percentiles and quantiles, highlighting that while there is a slight difference between them, they can generally be used interchangeably. The focus is on understanding the concept rather than the calculation, which is typically done using software like R. The video uses a small dataset of 13 student grades to illustrate these concepts. The median, which is the 50th percentile or quantile, is explained as the value that divides the dataset into two equal halves. The first quartile (25th percentile) and third quartile (75th percentile) are also discussed, with the video emphasizing the importance of these quartiles in dividing the data into quarters. The video concludes by mentioning that while quartiles are commonly used, any percentile can be reported, and it also touches on the idea of using percentiles to understand the position of a specific value within a dataset.
📈 Applying Percentiles to Evaluate Data Points
The second paragraph delves into how percentiles can be used to evaluate the position of a specific data point within a dataset. It explains that knowing the average and the spread of the data is crucial for understanding where a particular value stands. The paragraph uses the example of a grade of 82 to illustrate how its percentile ranking can vary depending on the dataset's range and average. The video also mentions that percentiles are not just for defining a specific value but can also be used to determine what percentile a given value falls into. Lastly, the paragraph briefly introduces the concepts of tertiles, quintiles, and deciles as alternative ways to divide data, suggesting that quartiles are a common choice but other divisions might be used depending on the context.
Mindmap
Keywords
💡Percentiles
💡Quantiles
💡Quartiles
💡Median
💡First Quartile (Q1)
💡Third Quartile (Q3)
💡Box Plot
💡Minimum and Maximum
💡Statistical Software
💡Interpreting Grades
Highlights
Percentiles and quantiles are discussed, with a slight difference but mostly used interchangeably.
Quartiles are specific values of percentiles or quantiles.
Focus is on the concept rather than the calculations, as software is typically used for calculation.
R statistical software has multiple methods for calculating percentiles or quantiles.
The median, or 50th percentile, is introduced as a value that divides data into 50% below and 50% above.
The first quartile (Q1), or 25th percentile, divides data into quarters, with 25% below and 75% above.
The third quartile (Q3), or 75th percentile, is another key quantile with 75% of observations below it.
Box plots visualize median, first quartile, third quartile, minimum, and maximum values.
Quartiles divide data into four equally sized quarters and are commonly reported.
Percentiles can be any value, not just quartiles, to describe the distribution of data.
Understanding percentiles helps interpret individual data points in the context of the dataset.
The video discusses how to determine the percentile rank of a specific value within a dataset.
Other divisions of data include tertiles, quintiles, and deciles, each breaking data into different group sizes.
The importance of knowing what quantiles or percentiles are and their practical applications is emphasized.
Software is typically used for calculating percentiles and quartiles, rather than manual calculation.
Transcripts
in this video we're going to talk a bit
about percentiles and quantiles as well
as quartiles so percentiles and
quantiles while there is a slight subtle
difference between the two we can use
them interchangeably for the most part
and then we'll talk about quartiles
which are specific values of a
percentile or quantile a quick reminder
to subscribe and click on the bell to
receive notifications when we upload new
videos we're going to focus on the
concept and not the calculations and
that's for a few reasons the first being
that typically we're going to calculate
these using a piece of software and
we're not going to do it by hand and the
second reason is the software that I use
I use these statistical software R it
has nine different ways of calculating a
percentile or quantile so we don't want
to get stuck on you know the
technicalities of way one verse way to
versus way three we want to focus on the
concept of what are they and what are
they useful for so in order to do this
I've got this example here looking at
the grades for 13 students I've kept the
dataset small and simple so that we can
focus on the concepts so here we got the
13 grades as well as I place them on a
number line here for visualization so
let's start with a specific or a
commonly looked at percentile or
quantile the fiftieth percentile
so this gets a special name and this
gets called the median is just the 50th
percentile or quantile again this has
50% of the ordered observations below it
it's looking at which value cuts the
data in half if we look at it here the
value of 77 has 1 2 3 4 5 6 below and 6
above ok so this is the value that cuts
the data set in half 50% below 50% above
ok so that's looking at this right here
half below 1/2 bit above now let's um
talk about another commonly looked at
percentile or quantile the 25th
percentile
and this again gets its own special name
it gets called the first quartile or
abbreviated q1 okay what this is well
it's the 25th percentile or the
twenty-fifth quantile and what that
means is it has 25 percent or one
quarter of observations below it so the
median is the value that cuts the date
in half half below half above the first
quartile cuts it into 1/4 1/4 below and
three quarters above okay well we said
there's slightly different ways of
calculating exactly what this value is
we can see it falls roughly in here
right this would cut 1/4 below 3/4 above
and will not get stuck on the details of
is it 67 or 64 what value exactly in
between but it's falling roughly around
here let's label this this is q1 this is
the median forgot to label that earlier
again another important percentile
writer quantile is the 75th percentile
again this gets its own special name it
gets called the third quartile the third
quarter so again abbreviated q3 and this
here is the 75th percentile or the 75th
quantile and this has 75% or
three-quarters of observations below it
and again locating stuck on the exact
number looks like it's roughly around
here it cutting it to have three
quarters below 1/4 above so it's kind of
in the range both there so this is the
third quartile
under the 75th percentile or 75th quanto
some other important I guess points to
mention are the minimum value as well as
the maximum right are the zero and the
hundredth percentile now something
encountered in a separate video but
worth mentioning here is that the box
plot is actually a visualization a
graphical visualize
of the median first quartile third
quartile minimum and Max so it draws a
box on these and a line extending to
those now quartiles are commonly used
percentiles or quantiles as they divide
the data into four equally sized
quarters and there are a common
description you see but really you can
report any value of percentile or
quantile so just as an example the 90th
percentile this gives us the value that
90% of observations are below again the
40th percentile which value are 40
percent of observations less than okay
so the first quartile and third quartile
or the 25th and 75th percentile those
ones are often reported as they're kind
of nice percentiles to look at but
really we can report any percentile we
want it's also important to note that
right now our discussion has been on
defining a percentile say the 75th
percentile and finding out which value
that corresponds to we can also look at
it the other direction we might take an
observed value say something like this
here right the 82 and try and decide
what percentile is that value care in
other words if I told you this someone
scored a grade of 82 it's really hard to
know is that a high grade or low grade
you need to know what was the average
you also need to know how spread out are
things where and if I tell you someone
scored a grade of 82 and grades range
somewhere between 50 percent up to a
hundred percent with an average say of
80 the grade of 82 is fairly average
right slightly above the mean of 80 if I
were to tell you there's a difference
class right they also had a mean of 80
but the lowest grade say was 75 the
highest grade was 83 that's actually a
really high grade right there up at the
the top end of the range so suppose I
tell you that grade of 82 percent fell
in the on the 80th percentile right now
you know that that grade is higher than
80 percent of the class okay so again
you can take observations and find out
what percentile they fall into so as we
noted through this video in a real world
you're probably never going to calculate
any of these by hand and you're gonna
use a piece of software to do that but
it's important to know what a quantile
or percentile is and what they're useful
for one final thing to close on apart
from quartiles sometimes you'll hear
reported tersh aisles these break the
data into the lowest third middle third
up will fear upper third or quintiles
break it into five groups or sometimes
deciles
break into ten equally sized groups so
break into quarters is a common one to
look at but you might hear of other ones
if they fit almost as yummy as chocolate
subscribe to our Channel
Sharyl videos stick around guys cuz we
saw lots more
浏览更多相关视频
Percentiles (1.7)
03. Cómo describir una variable numérica | Curso de SPSS
Ch 3 Lecture Video, Fall 2024: Measures of Central Tendency
Tutorial 4- Measure Of Central Tendency- Mean, Median And Mode In Hindi
How to Tally, Encode, and Analyze your Data using Microsoft Excel (Chapter 4: Quantitative Research)
How To Make Box and Whisker Plots
5.0 / 5 (0 votes)