Mean, Median and Mode in Statistics | Statistics Tutorial | MarinStatsLectures

MarinStatsLectures-R Programming & Statistics
3 Sept 201910:40

Summary

TLDRThis educational video script delves into measures of central tendency for numeric data, focusing on the mean, trimmed mean, median, and mode. It explains the sample mean, or arithmetic average, and its sensitivity to outliers. The concept of balance point is introduced to describe the mean visually. The median is discussed as a robust measure that divides data into halves, contrasting with the mean's tendency to be influenced by skewness. The trimmed mean, which removes extreme values, is briefly mentioned. Lastly, the mode as the most frequent value is introduced, noting its less common use in statistical analysis. The script emphasizes understanding these measures conceptually over manual calculation.

Takeaways

  • 📐 The mean (also known as the arithmetic average) is a measure of central tendency that represents the average value of a numeric variable.
  • 🎩 The mean is sensitive to outliers and can be pulled towards extreme values, making it less representative of the typical data point.
  • 🔄 The concept of the mean can be visualized as a balance point, where the data set is evenly distributed around this point.
  • ✂️ Trimmed mean is a variation of the mean that removes the top and bottom percentages of data to reduce the impact of outliers.
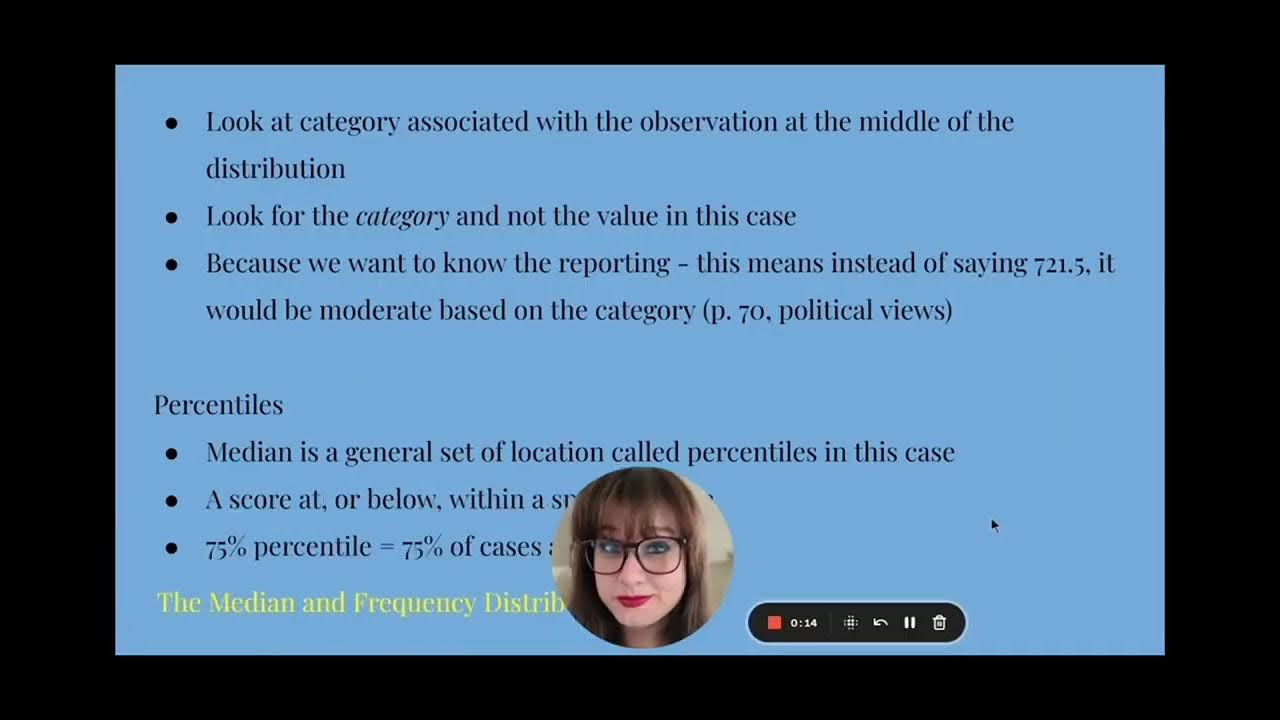
  • 🔽 The median is the middle value of an ordered data set and is not affected by outliers, making it a robust measure of central tendency.
  • 📊 The median divides the data set into two equal halves, with 50% of the data below and 50% above the median value.
  • 📈 The mean and median can differ, especially in skewed distributions, where the mean may be pulled towards the direction of the skew.
  • 🏆 The mode is the most frequently occurring value in a data set and is a less commonly used measure of central tendency.
  • 📚 Both parametric (like the mean) and nonparametric (like the median) measures are discussed, highlighting their different uses and interpretations.
  • 💡 The script emphasizes understanding the concepts and interpretations of these measures over manual calculation, as software can easily compute them.

Q & A

  • What is the mean, also known as the arithmetic average?

    -The mean, or arithmetic average, is a measure of central tendency that represents the average value of a numeric variable. It is calculated by summing all the values in a dataset and then dividing by the total number of observations.

  • What is a trimmed mean and how is it different from the regular mean?

    -A trimmed mean is a type of mean calculated after removing a certain percentage of the highest and lowest values from the dataset. This is done to make the mean less sensitive to outliers. It differs from the regular mean in that it doesn't consider the full range of data points.

  • How is the median defined and how does it differ from the mean?

    -The median is the middle value of an ordered dataset, dividing it into two equal halves. It differs from the mean in that it is not affected by outliers or extreme values, making it a more robust measure of central tendency for skewed distributions.

  • What is the mode and why is it less commonly used in statistical analysis?

    -The mode is the most frequently occurring value in a dataset. It is less commonly used in statistical analysis because it doesn't provide as much information about the central tendency of the data as the mean or median, especially for datasets that do not have a clear single mode.

  • How does the mean represent a balance point for the data?

    -The mean is considered a balance point because it is the point at which the sum of the deviations of each observation from the mean is minimized, conceptually balancing the data around a central value.

  • What is the difference between a parametric and nonparametric measure?

    -Parametric measures, like the mean, make assumptions about the distribution of the data (e.g., normality) and use parameters to describe the data. Nonparametric measures, like the median, do not rely on these assumptions and are often used with non-normally distributed data or when the data does not meet the assumptions required for parametric tests.

  • How sensitive is the mean to outliers, and why?

    -The mean is highly sensitive to outliers because it is influenced by the magnitude of all the values in the dataset. Outliers, being extreme values, can significantly pull the mean towards them, affecting the central tendency representation.

  • Why might the median be a more useful measure than the mean for certain types of data?

    -The median might be more useful than the mean for data with outliers or skewed distributions because it is not affected by extreme values. This makes it a more reliable measure of central tendency for such data, providing a better representation of the 'typical' value.

  • How is the concept of 'balance point' used to understand the mean?

    -The concept of 'balance point' is used to understand the mean by imagining the data points as weights on a balance scale. The mean is the point at which the scale would be perfectly balanced, with no tilt towards any side, representing the average position of all data points.

  • What is the significance of the notation used in statistical formulas, and why is it important?

    -The notation used in statistical formulas is significant because it provides a concise and standardized way to represent complex mathematical concepts. It allows for clear communication among statisticians and helps in understanding the underlying principles without getting lost in the details of verbal explanations.

Outlines

00:00

📊 Introduction to Measures of Central Tendency

This paragraph introduces various measures of central tendency for numeric variables, specifically the mean, trimmed mean, median, and mode. The mean, also known as the arithmetic average, is described along with its notation and sensitivity to outliers. The concept of balancing the data to find the mean is introduced. The paragraph also sets the stage for comparing these measures and understanding their differences and applications.

05:01

🔢 Detailed Explanation of Mean, Median, and Mode

The paragraph delves into the concept of the mean as a balance point for data and contrasts it with the median, which is the middle value of an ordered dataset. It explains how the mean can be influenced by extreme values, while the median remains robust against them. The trimmed mean is briefly discussed as a method to reduce the mean's sensitivity to outliers. The mode, as the most frequently occurring value, is also introduced, highlighting its less common use in statistical analysis but its utility in certain contexts.

10:03

📚 Conclusion and Practical Implications

The final paragraph emphasizes the importance of understanding the formulas for mean, median, and mode not just for calculation, but also for gaining insight into their functions and applications. It stresses the practical use of these measures in different contexts and acknowledges the role of software in calculating them, suggesting that the focus should be on understanding rather than manual calculation.

Mindmap

Keywords

💡Measures of Central Tendency

Measures of central tendency are statistical measures that describe the center point of a data set. In the video, the speaker discusses three specific measures: mean, median, and mode. These measures are central to understanding the distribution of data and are used to summarize the 'typical' value within a set of numbers. The video's theme revolves around these measures, as they provide different perspectives on what is considered 'central' or 'average' in a data set.

💡Mean

The mean, also known as the arithmetic average, is the sum of all the values in a data set divided by the number of values. It is sensitive to outliers and is described in the video as a balance point where the data set would be evenly distributed. The video uses the example of a small data set of student grades to calculate the mean, which comes out to 71.5, illustrating how the mean can be influenced by extreme values.

💡Trimmed Mean

The trimmed mean is a variation of the mean where a certain percentage of the highest and lowest values are removed before calculating the average. This measure is discussed in the video as a way to make the mean less sensitive to outliers. It's mentioned as a less commonly used measure but still valuable in certain contexts where extreme values might skew the true center of the data.

💡Median

The median is the middle value of a data set when the values are arranged in ascending order. If there is an even number of observations, the median is the average of the two middle numbers. The video explains that the median is not sensitive to outliers and cuts the data in half, which contrasts with the mean's tendency to be pulled towards extreme values. The median of the example data set is calculated to be 74.5, highlighting its robustness against skewness.

💡Mode

The mode is the value that appears most frequently in a data set. It is mentioned in the video as the least commonly used measure of central tendency but can be useful in contexts where the focus is on the most common value. In the provided example, the mode is 70, as it is the grade that appears most often among the students.

💡Outliers

Outliers are values that are significantly different from other values in a data set. The video discusses how the mean is sensitive to outliers, as they can pull the mean towards them, affecting the measure of central tendency. The example of a grade of 25 is used to illustrate how an outlier can influence the mean, while the median remains unaffected.

💡Skewness

Skewness refers to the asymmetry of the distribution of values in a data set. The video explains that if a distribution is skewed, the mean can be pulled towards the direction of the skewness. This is contrasted with the median, which is not affected by skewness and simply cuts the data in half.

💡Parametric Measure

A parametric measure is one that assumes the data comes from a population that follows a specific probability distribution. The video introduces the concept by noting that the sample mean is considered a parametric measure. It implies that the mean is used under the assumption that the data is normally distributed, which is a common assumption in many statistical analyses.

💡Nonparametric Measure

Nonparametric measures do not assume that the data comes from a specific probability distribution. The video contrasts parametric measures with nonparametric ones, highlighting that the median is a nonparametric measure. This means that the median can be used regardless of the shape of the data's distribution, making it a versatile tool for summarizing central tendency.

💡Balance Point

The concept of a balance point is used in the video to describe the mean as a point that would balance all the values in a data set if they were weights on a seesaw. This analogy helps to visualize how the mean is influenced by the distribution of values, especially by heavier weights (larger values) that can pull the balance point towards them.

💡Sensitivity to Extreme Values

The video discusses the sensitivity of certain measures of central tendency, like the mean, to extreme values. It explains that extreme values can significantly affect the mean, while the median is more robust and less affected by such values. This is important in statistical analysis because it influences the choice of which measure to use depending on the nature of the data.

Highlights

Introduction to measures of central tendency for numeric variables

Explanation of the mean (arithmetic average)

Mean is sensitive to outliers and can be pulled towards extreme values

Mean as a balance point for data distribution

Mean represented by Latin letters for sample estimates and Greek letters for population values

Definition and calculation of the sample mean

Trimmed mean as a variation of the mean to reduce sensitivity to outliers

Introduction to the median as a measure of central tendency

Median is the middle value and is not sensitive to outliers

Median is a nonparametric measure

Comparison of mean and median in symmetric distributions

Difference between mean and median in skewed distributions

Practical applications of mean and median in different contexts

Introduction to the mode as a measure of central tendency

Mode as the most common value in a dataset

Mode's limited use in statistical analysis

Importance of understanding formulas for insight rather than manual calculation

Transcripts

play00:00

let's talk a little bit about measures

play00:02

of central tendency for a numeric

play00:04

variable so specifically we're going to

play00:07

talk about the mean what's also known as

play00:09

the arithmetic average trimmed mean a

play00:11

median as well as the moat you likely

play00:14

already know about most or all of these

play00:16

but I'm sure that we're gonna be able to

play00:18

add something new for you here or at

play00:19

least give you a new way of seeing some

play00:21

things so to do so we're gonna use this

play00:24

simple example here where I've got

play00:26

grades recorded for 8 students so I've

play00:29

got them placed here already in order

play00:31

from smallest to largest and I've also

play00:33

put the points here on a number line and

play00:35

I'm using only 8 observations again so

play00:38

we can have a small simple data set that

play00:41

we can do all the calculations quickly

play00:42

by hand with and focus on the concepts

play00:45

so let's start by looking at what we

play00:48

call the sample mean something that you

play00:50

likely already know it's an average or

play00:52

arithmetic average and this often gets

play00:55

abbreviated using x-bar or mu hat as

play01:00

noted earlier we often use Latin letters

play01:04

to represent estimates from a sample and

play01:06

we use Greek letters to represent the

play01:09

true or population value so sometimes

play01:11

we'll also throw a hat on top of the

play01:13

Greek letter to indicate that it's a

play01:15

sample estimate of the population value

play01:17

so this sample mean first writing it in

play01:20

notation form it's the sum I going from

play01:25

1 up to n of X I divided by n okay so

play01:30

let's translate that what does that

play01:32

notation mean a note on notation it can

play01:36

be a bit difficult at first to translate

play01:38

notation mathematical notation is

play01:41

essentially writing in a different

play01:42

language and we don't want it to get in

play01:44

the way and confuse things but it also

play01:45

is important to be able to have a

play01:47

concise language that we can write

play01:48

things simply in short to represent

play01:51

bigger ideas so here we're saying some I

play01:55

going from 1 up to n X I so that's X 1

play01:59

plus X 2 plus X 3 all the way up to X n

play02:05

divided by N and in our sample that's

play02:09

saying X 1 the first observation is 25 X

play02:12

2

play02:13

the second is 70 X 3 the third one is

play02:16

seventy fourth one is 72 all the way up

play02:19

to 90 divided by the total number of

play02:23

observations and that's going to come

play02:24

out to be seventy one point five okay so

play02:27

again likely not a new idea but this

play02:29

does a few things first it gets us I'm

play02:31

used to a little bit of notation and

play02:33

we're also going to hopefully learn to

play02:36

think about the mean in a slightly

play02:37

different way a few things to note about

play02:39

the sample mean is that it's sensitive

play02:43

to outliers so when there's outlying

play02:48

values or extreme values the mean can

play02:50

get pulled towards those so this small

play02:53

grade of 25 is pulling the mean towards

play02:56

it right we can see the mean is seventy

play02:58

one point five and and if we were to use

play03:01

other descriptions of the center we

play03:02

might use something a little bit closer

play03:04

to you know 75 or 77 something like that

play03:08

the the key point is that the mean is

play03:10

sensitive to outliers or skewness or

play03:12

extreme values and it gets pulled

play03:14

towards those another thing to think

play03:16

about the way I like to think about the

play03:18

mean as I think of it as being a balance

play03:21

point so what it does is it takes all

play03:23

these observations and tries to balance

play03:26

them so let me try and give you a

play03:28

description of what I mean by that so

play03:30

suppose we were to draw a board here and

play03:36

all these observations are sitting on

play03:39

top of this board right let's just think

play03:41

of them as little rocks or little

play03:42

weights where what do we have to put

play03:45

into a needle under this board in order

play03:47

for it to balance if we put it here what

play03:50

we would notice it would tip what if we

play03:53

put it here again it's going to tip that

play03:55

way okay so the mean is looking for a

play03:58

balance point so we put it somewhere

play04:01

about in here that's going to balance

play04:05

these this far point here is going to

play04:07

have more leverage right or pull it down

play04:09

a bit more so that's the way I've always

play04:11

liked to think of the mean is it's

play04:13

trying to find a balance point for the

play04:14

data in a moment we'll formally define

play04:16

the median but you likely already know

play04:18

what the median is the median is the

play04:21

value that cuts the data in half

play04:23

half below half above so while the mean

play04:26

and median are both measures of central

play04:28

tendency they do it in slightly

play04:29

different ways what cuts it in half

play04:31

versus what tries to balance the data

play04:33

one more thing to mention this probably

play04:35

won't have much meaning at this point

play04:37

but it will become more meaningful as we

play04:39

progress through this material the

play04:41

sample mean is what gets to known as a

play04:43

parametric measure okay and as we

play04:45

progress through these ideas we're going

play04:47

to slowly start to differentiate between

play04:48

parametric versus nonparametric right

play04:51

now they're just words and one one final

play04:54

thing to attach to the mean before we

play04:55

move on if we're talking about a

play04:57

population mean and by that we mean the

play05:00

mean or the average for the entire

play05:02

population rather than just a sample we

play05:06

abbreviate that with mu now the

play05:09

population mean is often a theoretical

play05:11

idea usually we don't know the true mean

play05:13

for the entire population but we're

play05:15

going to start to move back and forth

play05:16

between wanting to know the population

play05:18

mean taking a sample to try and estimate

play05:20

the mean for a population so again those

play05:22

are ideas that we're working our way

play05:24

towards let's give a very quick mention

play05:26

to the idea of a trimmed mean

play05:28

essentially what this is is calculating

play05:33

the mean you have a sample mean

play05:35

after removing the top and the bottom

play05:38

alpha percent of data so maybe cutting

play05:42

off the lowest five percent of values

play05:44

the highest five percent of values and

play05:45

then calculating the mean we're in this

play05:48

example maybe removing the lowest and

play05:49

the highest right and then calculating

play05:51

the mean of those yes they're just

play05:53

trimming off some of the extremes and

play05:54

this is a way of trying to make the mean

play05:56

less sensitive to outliers or extreme

play05:59

values it's often not used very much in

play06:03

in statistical applications but it has

play06:05

its place in the world as a summary

play06:07

measure the next measure is the median

play06:09

and again this is the middle value of

play06:12

the ordered observations what value cuts

play06:16

the data in half 50% below 50% above so

play06:21

we can see if we look at these data here

play06:24

the median is going to be somewhere in

play06:26

here it cuts it for below for above

play06:29

somewhere in between the 72 and the 77

play06:33

so if our dataset has an even number of

play06:35

observations what we're going to do is

play06:38

take the two that are sharing the middle

play06:40

space and average them so the 72 plus 77

play06:45

divided by two seventy four point five

play06:48

right because again the point that cuts

play06:51

the day in half is somewhere between the

play06:52

72 and the 77 some important things to

play06:56

note about the median the first is that

play07:00

it is not sensitive to outliers here

play07:05

sometimes it gets called robust if this

play07:07

grade of 25 changed and was 15 the

play07:11

median won't change right the mean will

play07:12

the mean will get pulled lower and if

play07:14

this grade of 25 was 0 the median is

play07:17

still the same right so it's not

play07:19

sensitive to outliers or extreme values

play07:21

when it does is it cuts the data in half

play07:26

right so again as noted before the mean

play07:29

is more like a balance point right

play07:31

trying to find what point balances the

play07:32

data the median is what cuts it half

play07:36

below half above and again another word

play07:39

that doesn't have much meaning now but

play07:41

will slowly take on meaning as we

play07:43

progress through ideas the median is a

play07:45

nonparametric measure now let's just

play07:49

take a moment to talk about mean verse

play07:51

median and how they compare so if a

play07:53

distribution is fairly symmetric so

play07:57

let's write this down when a

play07:58

distribution is symmetric the mean is

play08:02

roughly the same as the median okay so

play08:05

the measure of central tendency is going

play08:07

to be the same using mean or median if

play08:09

the distribution is roughly symmetric

play08:11

around its center if it's skewed if the

play08:14

distribution is skewed the mean is kind

play08:18

of I like to use the word pulled that's

play08:20

the way I think of it is pulled towards

play08:22

the skewness so again we talked

play08:25

previously about the idea of incomes and

play08:28

how these often have a skewed right

play08:31

distribution we're thinking about a

play08:33

distribution that's skewed to the right

play08:35

the median is this valley

play08:40

that cuts the data in half roughly 50%

play08:42

of the area below 50% above because of

play08:45

these large values the mean is gonna get

play08:47

pulled by those and the mean ends up

play08:51

being a little bit larger than the

play08:52

median or getting pulled towards that

play08:54

skewness one is not a better measure

play08:57

than the other there's slightly

play08:58

different ways of trying to describe the

play09:00

center I like to think of if we're

play09:03

talking about incomes median income is a

play09:06

little bit more useful if you want to

play09:07

know about the typical income of an

play09:09

individual right the median income would

play09:12

tell us here's the income half the

play09:14

people make more than half make less

play09:16

than okay so what's the middle income if

play09:18

we're thinking at a population or

play09:20

governmental level we might want to know

play09:22

about mean income right this is telling

play09:24

us how many dollars are earned per

play09:26

person right on average so again what is

play09:28

not better than the other there's

play09:30

slightly different ways of describing

play09:31

the center of a distribution the last

play09:34

measure of central tendency that we can

play09:36

talk about is the mode the mode is the

play09:39

most common value which value is most

play09:43

commonly I'm showing up in our data set

play09:45

in our little simple example here it's

play09:48

70 right 70 is the one that we've seen

play09:51

most often so the mode is less commonly

play09:55

used in kind of statistical analysis but

play09:58

again it can be a useful summary measure

play10:00

in different contexts if you want to

play10:02

know what what value is showing up most

play10:04

frequently and important reminders we've

play10:06

said a few times through this series of

play10:07

videos we're not going to focus on the

play10:10

calculation of these we can always have

play10:12

a piece of software calculate the mean

play10:14

and median and mode for us we don't

play10:16

really want to get stuck on calculating

play10:17

these by hand but we look at the

play10:19

formulas again to give us some insight

play10:22

and understanding of what what exactly

play10:24

are they doing and how do they work

play10:26

thanks for watching our video stick

play10:29

around guys cause we'd all Rock more

play10:34

I want you down

play10:39

[Music]

Rate This

5.0 / 5 (0 votes)

相关标签
StatisticsCentral TendencyMeanMedianModeData AnalysisOutliersBalance PointTrimmed MeanRobust Measure
您是否需要英文摘要?