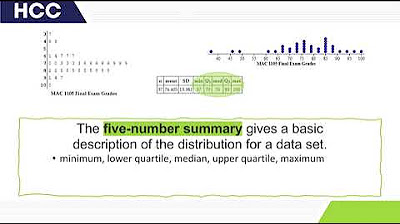
Five-Number Summaries and Boxplots
Summary
TLDRThis educational video script teaches how to use the five-number summary (minimum, Q1, median, Q3, maximum) to analyze a dataset's distribution and identify outliers. It explains how to calculate the interquartile range (IQR) and use it to determine the lower and upper limits for spotting outliers. The script also instructs on constructing a boxplot, a visual representation of the dataset's center and variation, using the five-number summary and adjacent values. The example of U.S. presidents' ages at inauguration is used to illustrate these concepts, showing how to compute and apply these statistical measures.
Takeaways
- 📊 The five-number summary of a dataset includes the minimum, first quartile (Q1), median, third quartile (Q3), and maximum.
- ⬆️ To find the five-number summary, data must be sorted in ascending order to easily identify the minimum and maximum.
- 🔢 The median, which is the 50th percentile, divides the dataset into two equal halves.
- 📈 Q1 is defined as the median of the lower half of the dataset, and Q3 is the median of the upper half.
- 🧩 For datasets with an even number of observations, Q1 and Q3 are calculated as the average of the two middle values in their respective halves.
- 📉 The interquartile range (IQR) is calculated as Q3 minus Q1, representing the range of the middle 50% of the data.
- ⚠️ Outliers are identified using the IQR; values below Q1 - 1.5*IQR or above Q3 + 1.5*IQR are considered outliers.
- 📋 A boxplot, or box-and-whisker diagram, visually represents the five-number summary and can indicate the presence of outliers.
- 📏 Adjacent values are the most extreme non-outlier data points, which are the minimum and maximum within the lower and upper limits if no outliers are present.
- 📊 The construction of a boxplot involves plotting the quartiles and adjacent values on a horizontal axis, then drawing the box and whiskers accordingly.
Q & A
What is the five number summary of a dataset?
-The five number summary of a dataset includes the minimum, the 25th percentile (Q1), the median (50th percentile), the 75th percentile (Q3), and the maximum.
How do you determine the minimum and maximum in a five number summary?
-The minimum and maximum in a five number summary are the smallest and largest values in the dataset, respectively, after it has been organized in ascending order.
What is the median and how is it found in a dataset?
-The median is the middle value of a dataset when it is ordered from smallest to largest. If the number of observations is odd, the median is the middle value. If it's even, the median is the average of the two middle values.
How is Q1 (the first quartile) defined in the context of the five number summary?
-Q1, or the first quartile, is defined as the median of the bottom half of the dataset, which divides the lower 50% of the data.
What does Q3 (the third quartile) represent in the five number summary?
-Q3, or the third quartile, is the median of the upper half of the dataset, which divides the upper 50% of the data.
What is the Interquartile Range (IQR) and how is it calculated?
-The Interquartile Range (IQR) is the difference between Q3 and Q1, representing the width of the middle 50 percent of the dataset.
How are the lower and upper limits of a dataset determined?
-The lower limit is calculated by subtracting 1.5 times the IQR from Q1, and the upper limit is calculated by adding 1.5 times the IQR to Q3.
What are outliers in a dataset and how are they identified?
-Outliers are values that are greater than the upper limit or less than the lower limit of a dataset. They are identified by comparing each data point to the lower and upper limits.
What is a boxplot and what does it represent?
-A boxplot, also known as a box-and-whisker diagram, is a graphical representation of the five number summary and is used to visualize the central tendency and dispersion of a dataset.
How do you construct a boxplot for a given dataset?
-To construct a boxplot, first determine the five number summary and calculate any outliers or adjacent values. Then, draw a horizontal axis and mark the quartiles and adjacent values with vertical lines. Connect the quartiles to form a box and extend lines to the adjacent values. Mark outliers with an asterisk if present.
What are adjacent values in the context of a boxplot?
-Adjacent values are the most extreme observations within the lower and upper limits of a dataset, which are not considered outliers.
How can the shape of a dataset's distribution be determined from a boxplot?
-The shape of a dataset's distribution can be inferred from a boxplot by examining the relative positions and lengths of the box and whiskers. For example, a boxplot with symmetric whiskers might suggest a normal distribution.
Outlines

此内容仅限付费用户访问。 请升级后访问。
立即升级Mindmap

此内容仅限付费用户访问。 请升级后访问。
立即升级Keywords

此内容仅限付费用户访问。 请升级后访问。
立即升级Highlights

此内容仅限付费用户访问。 请升级后访问。
立即升级Transcripts

此内容仅限付费用户访问。 请升级后访问。
立即升级5.0 / 5 (0 votes)


