Statistics Grade 10: Box and whisker
Summary
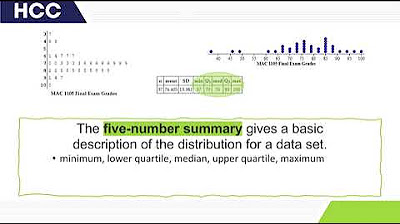
TLDRIn this lesson, the teacher explains the five-number summary and how to create a box-and-whisker plot. The five-number summary includes the minimum value, lower quartile (Q1), median (Q2), upper quartile (Q3), and maximum value. Using a sequence of numbers, the teacher demonstrates calculating each component and plotting them on a box-and-whisker diagram. The lesson emphasizes the importance of using a ruler for accuracy and briefly discusses data skewness based on the whisker lengths. This provides a clear and concise understanding of these fundamental statistical concepts.
Takeaways
- π The five number summary includes the minimum value, lower quartile (Q1), median (Q2), upper quartile (Q3), and the maximum value.
- π To find the lower quartile (Q1), use the formula \( \frac{(n + 1)}{4} \) and interpolate between the values at the calculated position.
- π’ The median is found by using the formula \( \frac{(n + 1)}{2} \) and selecting the value at the resulting position in the data set.
- π The upper quartile (Q3) is calculated similarly to Q1, but using \( \frac{3 \times (n + 1)}{4} \) to find the position.
- π The maximum and minimum values are the highest and lowest numbers in the data set, respectively.
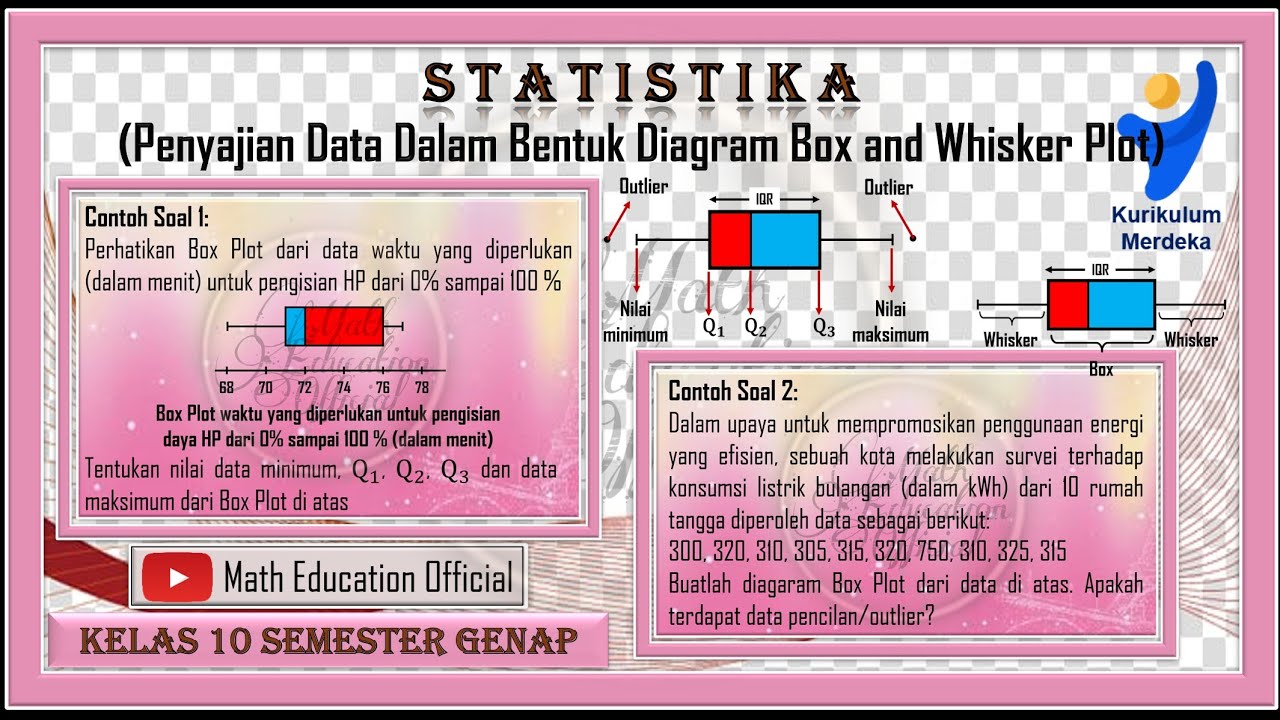
- π A box and whisker diagram visually represents the five number summary, with a box for the interquartile range (IQR) and whiskers for the minimum and maximum values.
- π It's important to use a ruler when drawing a box and whisker diagram to ensure accuracy in the representation.
- π The length of the whiskers can indicate the skewness of the data; a longer whisker on one side suggests the data is skewed in that direction.
- π The script provides a step-by-step guide on how to calculate each part of the five number summary using a specific data set.
- π Teachers may refer to the median as Q2, emphasizing its position as the halfway point in the data set.
- π€ Understanding the concept of skewness is simplified to recognizing which side the longer whisker is on, indicating the direction of skew.
Q & A
What is the five number summary in statistics?
-The five number summary includes the minimum value, the lower quartile (Q1), the median (Q2), the upper quartile (Q3), and the maximum value of a data set.
How is the lower quartile (Q1) calculated?
-Q1 is calculated by taking the position at (n + 1) / 4, where n is the number of values in the data set, and then finding the value at that position or the average of the values at that position.
What is the median and how is it found?
-The median is the middle value of a data set when it is ordered from least to greatest. It is found by taking the position at (n + 1) / 2 and locating the value at that position.
How do you calculate the upper quartile (Q3)?
-Q3 is calculated by taking the position at 3 * (n + 1) / 4, finding the value at that position, and then averaging it with the next value if necessary.
What is the maximum value in the five number summary?
-The maximum value is the highest number in the data set.
What is a box and whisker diagram and how is it related to the five number summary?
-A box and whisker diagram is a graphical representation of the five number summary, showing the minimum, Q1, median, Q3, and maximum values, with a box for the interquartile range and whiskers extending to the minimum and maximum values.
Why is it recommended to use a ruler when drawing a box and whisker diagram?
-Using a ruler helps to ensure that the diagram is accurately scaled and that the relative lengths of the box and whiskers correctly represent the data distribution.
What does the length of the whiskers in a box and whisker diagram represent?
-The length of the whiskers represents the spread of the data outside the interquartile range, indicating the variability of the data.
How can you determine if a box and whisker diagram is skewed to the right or left?
-A box and whisker diagram is considered skewed to the right if the right whisker is longer, indicating that the data tail extends more to the right. It is skewed to the left if the left whisker is longer.
What is the significance of the interquartile range (IQR) in a box and whisker diagram?
-The interquartile range (IQR), which is the distance between Q1 and Q3, represents the middle 50% of the data set and provides insight into the data's central tendency and dispersion.
Can you provide an example of how to calculate Q1, median, and Q3 from the given data sequence?
-For the given data sequence, the minimum is 8, Q1 is 12.5, the median (Q2) is 19, Q3 is 27, and the maximum is 40.
Outlines
π Introduction to Five Number Summary and Box Plot
This paragraph introduces the concept of the five number summary and the box and whisker diagram, which are fundamental statistical tools. The five number summary includes the minimum value, the lower quartile (Q1), the median, the upper quartile (Q3), and the maximum value. The explanation walks through the process of calculating each of these values using a given data set, with the example numbers being 8, 12.5, 19, 27, and 40 respectively. The paragraph also touches on the creation of a box plot, emphasizing the importance of using a ruler for accuracy and how to interpret the skewness of the data.
Mindmap
Keywords
π‘Five Number Summary
π‘Box and Whisker Diagram
π‘Minimum Value
π‘Lower Quartile (Q1)
π‘Median
π‘Upper Quartile (Q3)
π‘Maximum Value
π‘Quartiles
π‘Skewness
π‘Interquartile Range (IQR)
Highlights
The five number summary is introduced as a simple concept.
The five number summary includes minimum, lower quartile (Q1), median, upper quartile (Q3), and maximum values.
The minimum value for the given sequence is identified as eight.
The lower quartile (Q1) is calculated using the formula n + 1/4, where n is the number of values.
Q1 is found to be 12.5 by averaging the values at positions 2.5 and 3.
The median is calculated using n + 1/2, indicating the halfway point in the data set.
The median value is determined to be nineteen, which is the fifth value in the sequence.
The upper quartile (Q3) is calculated using 3 * (n + 1/4).
Q3 is found to be 27, by averaging the values at positions 7.5 and 8.
The maximum value is straightforwardly identified as forty.
A box and whisker diagram is introduced as a visual representation of the five number summary.
The box and whisker diagram includes a box representing Q1, median, and Q3, and whiskers representing minimum and maximum.
The importance of using a ruler for drawing the box and whisker diagram is emphasized for accuracy.
The diagram is constructed by plotting the five number summary values on a ruler.
The concept of skewness is briefly introduced, with the longer whisker indicating the direction of skew.
The lesson concludes with a summary of how to calculate and interpret the five number summary and box and whisker diagram.
Transcripts
in class your teacher is definitely
going to talk about the five number
summary as well as the box and whisker
diagram these are very easy concepts and
that's what i'm going to explain in this
lesson
so the five number summary is simply the
following it's the minimum value
it's the lower
quarter sometimes called q1
it's the median value remember medium
small median large median is the number
that is halfway
and then the upper quarter
or quartile
that's usually called q3 and then the
maximum value so the minimum value for
this sequence that is given over here
would be eight okay so
i'm just gonna say here minimum is eight
the lower quarter remember quarter is n
plus one over four so the num n is the
number of values that's one two three
four five six seven eight nine so nine
plus one over 4 which is 2.5
that's not the answer that's the
position
so you go to position 2.5 which is
somewhere between these two so you say
11 plus 14 which is 25 divided by 2
which is 12 and a half so q1 which is
your lower quarter is 12 and a half then
we need the median now of course with
the median you could use elimination
where you cross out like that like that
like that but the more mathematical way
to do it and the better way is just to
say n plus one over two remember median
is half so you wanna share it
or you wanna divide it by two so n is
the number of values that we have which
is nine so we say nine plus one over two
so it's ten divided by two which is five
that's not the answer you go to position
five so it's one two three four
five so the fifth value is nineteen
so the median is nineteen some teachers
even call the median q2 because wouldn't
you agree that if you have a pizza that
is cut into four quarters if you color
in two quarters that's the same as
coloring in a half now we're going to
find the upper quarter so that's n plus
one over four so you divide it into
quarters but then you times that answer
by three so that's going to be three
times by nine plus one is ten ten
divided by four if you do that on the
calculator you get seven point five so
you go to position seven point five so
that's one two three four five six
seven
eight would have been that one so you
take the number that is exactly between
those two which is going to be 27 the
way i do that is i add them together and
then i divide them by two so q3 which is
your upper quarter is going to be 27 and
then the last thing we need is the
maximum value which is
40. and so if you are ever asked for the
five number summary well that's it now
we can use the five number summary and
we can draw something called a box and
whisker diagram very important you want
to use a ruler when doing this so i'm
not going to squeeze this in with a
ruler because i've gone and i've chosen
numbers that are so the numbers i've
chosen are going to be a little bit big
so i'm not going to do it with a ruler
just for just want to save a bit of time
but what you would do is you could start
at the you could start your ruler at the
zero position and you could put the 8
over there
then your next value that oh and then
you need to go all the way to 40 so we
can go all the way through to 40. then
you would put q1 which is 12 and a half
which would be somewhere over here
so that's
12.5 then the median value is 19 which
is about here q3 is 27 so that's about
here and then your maximum value is 40.
then these middle three you want to
connect them like that
and that's it that is called a box and
whisker so you've got the box which is
this part over here
and then you've got the two whiskers
which are these parts on the side
then your teacher might ask you is this
daughter skewed to the right skew to the
left don't even stress about what that
means really all you need to know is the
the longer whisker
is on the right hand side so we will
just say skew to the
right and that's it for this lesson so
guys the five number summary it's your
minimum your lower quartile which is q1
which is calculated with n plus one over
four your median which is n plus one
over two your upper quartile which is n
plus one over four but then you times
that by three and then your minimum and
maximum are obviously very easy to do
then you want to do it with a ruler
because if you don't do with a ruler
your graph's always going to look like
this you're going to make it look
perfectly balanced but when you do it on
a ruler then you are able to see exactly
what it looks like if it's longer on
that side or on that side okay perfect
5.0 / 5 (0 votes)