$750 Billion Set to Surge into Markets: The Fed's Next Move Explained!

Mark Moss
15 Aug 202418:14

Summary

TLDRThis video script discusses the impact of the Treasury General Account (TGA) on asset prices amidst economic uncertainties. It highlights the potential for a significant liquidity injection into the economy through the TGA, especially during debt ceiling showdowns. The script suggests that such injections could lead to a rise in asset prices, including Bitcoin, tech stocks, and real estate, despite the broader economic implications. The presenter advises viewers to monitor these developments closely over the next 9 to 12 months for potential investment opportunities.

Takeaways

  • πŸ“‰ The script discusses the fear among investors due to market crashes, upcoming elections, and potential wars, suggesting that many economic indicators are signaling a recession.
  • πŸ“Š It highlights that while economic indicators can show the direction of the economy, they may not accurately predict asset prices, which are better indicated by liquidity levels.
  • πŸ’° The importance of the Treasury General Account (TGA) is emphasized as the government's bank account, which influences liquidity when it accumulates or releases funds.
  • πŸ“ˆ The script suggests that the TGA levels are currently high, which is typically bad for liquidity, but the government's future actions could inject significant funds into the economy.
  • πŸ€” The reliability of government forecasts is questioned, as they are often incorrect and later revised, which could impact understanding of future liquidity.
  • πŸ’‘ The concept of 'Extraordinary Measures' is introduced, where the government uses the TGA to fund operations during debt ceiling debates, potentially leading to increased liquidity.
  • πŸ—“οΈ Historical patterns show that during debt ceiling showdowns, the TGA is often drawn down to around $100 billion, which could happen again in the upcoming 2025 debt ceiling debate.
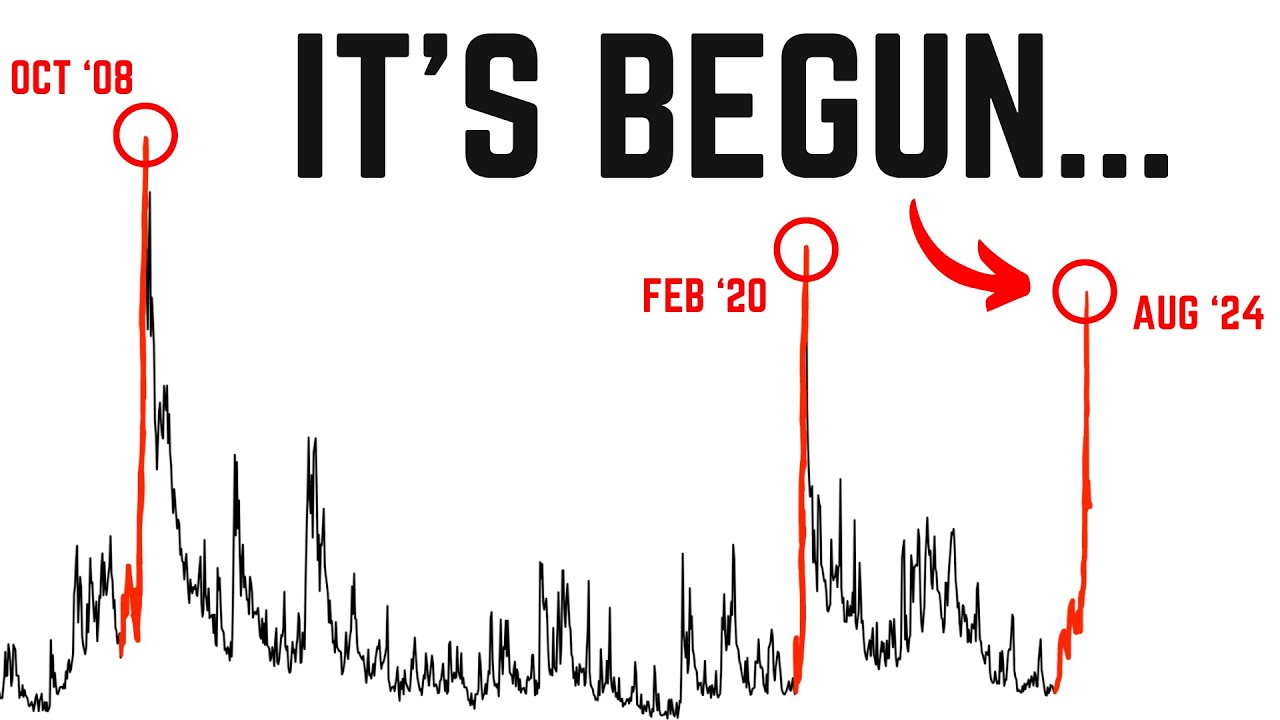
  • πŸ’Έ The potential for a massive liquidity increase is highlighted, suggesting that around $750 billion could be injected into the economy, similar to the 2008 TARP program.
  • πŸš€ The script predicts that this liquidity increase could lead to a rise in asset prices, including Bitcoin, tech stocks, and real estate, despite potential negative impacts on the overall economy.
  • πŸ”’ A cautionary note is given about the security of Bitcoin, recommending that individuals secure their own assets rather than relying on exchanges.
  • πŸ‘€ The video encourages viewers to keep an eye on the economic situation over the next 9 to 12 months, anticipating significant changes due to the potential liquidity injection.

Q & A

  • What is the main concern of investors mentioned in the video script?

    -The main concern of investors mentioned in the video script is the fear of an imminent market crash due to various factors such as economic indicators, yield curve inversion, weakening unemployment, slowing home sales, and potential political and military events.

  • What economic indicator is discussed as a signal for asset prices movement?

    -The Treasury General Account (TGA) is discussed as the best indicator for asset prices movement, as it reflects the liquidity in the system which directly affects asset prices.

  • What is the Treasury General Account (TGA) and why is it significant?

    -The Treasury General Account (TGA) is the U.S. government's bank account where it keeps its funds. It is significant because changes in the TGA balance can influence the liquidity in the economy, which in turn affects asset prices.

  • How does the level of the TGA account affect the economy?

    -When the TGA account is high, it indicates that money is being taken out of the market, reducing liquidity, which can be negative for the economy. Conversely, when the TGA is low or being drained, it is akin to injecting money into the economy, which can increase liquidity and potentially boost asset prices.

  • What is the expected change in the TGA account level by the end of Q3 2024 according to the government's estimates?

    -According to the government's estimates, the TGA account is expected to increase to about 850 billion by the end of Q3 2024.

  • What does the video suggest about the accuracy of government forecasts for the TGA account?

    -The video suggests that the government's forecasts for the TGA account are often inaccurate, as they have historically been revised after being proven wrong.

  • What is the 'debt ceiling showdown' mentioned in the script?

    -The 'debt ceiling showdown' refers to the political debate and negotiations that occur when the U.S. government approaches its borrowing limit and needs to decide whether to raise it to continue funding government operations.

  • What measures does the government take when it cannot agree on raising the debt ceiling?

    -When the government cannot agree on raising the debt ceiling, it takes 'extraordinary measures' which may include using the TGA account to fund the gap where they cannot get new debt.

  • How does the video script relate the TGA account to the potential increase in asset prices?

    -The script suggests that if the TGA account is drained and the funds are injected directly into the economy, it could lead to an increase in asset prices, as it did during the 2008 financial crisis with the TARP program.

  • What advice does the video give regarding Bitcoin and exchange security?

    -The video advises viewers not to trust their Bitcoin on exchanges and to secure it themselves using hardware devices like Trezor, which keep private keys safe and make the process of managing cryptocurrencies easier and more secure.

  • What is the potential impact of the TGA account changes on the U.S. economy and asset prices according to the video?

    -According to the video, changes in the TGA account can have a significant impact on the U.S. economy and asset prices. If the TGA is drained and the money is injected into the economy, it could lead to increased liquidity, which may result in higher asset prices, although it could also diminish the purchasing power of dollars.

Outlines

00:00

πŸ“‰ Economic Fears and Asset Price Indicators

This paragraph discusses the current economic climate marked by market crashes, upcoming elections, and potential wars, which have led to widespread fear among investors. It highlights various economic indicators such as yield curve inversion, unemployment, and slowing home sales, suggesting an imminent recession. However, the focus shifts to the importance of asset prices, which these indicators do not necessarily reflect. The best indicator for asset prices is currently positive, and the video promises to analyze the event in 2024 that will most impact these prices, contrasting the common fear-mongering narratives.

05:01

πŸ’° The Role of Treasury General Account (TGA) in Liquidity

The second paragraph delves into the concept of liquidity and its impact on asset prices. It introduces the Treasury General Account (TGA), the U.S. government's primary bank account, and its role in affecting market liquidity. When the TGA is high, it indicates less money circulating in the economy, which can negatively affect asset prices. Historical patterns of the TGA, especially during tax seasons, are examined, along with the government's estimates for the TGA levels in 2024. The paragraph also discusses the mechanics of how the TGA influences the economy, drawing parallels to deficit spending and quantitative easing.

10:03

πŸ›οΈ Debt Ceiling Showdown and its Impact on the TGA

This paragraph explores the historical context of the U.S. government's debt ceiling debates and their effects on the TGA. It explains that during these debates, the government often resorts to 'extraordinary measures,' using the TGA to fund the gap created by the lack of new debt. The paragraph presents a chart illustrating the TGA's fluctuations during previous debt ceiling showdowns and speculates on the potential impact of the upcoming 2025 event. It emphasizes the importance of understanding the TGA's drawdown levels and the potential for significant liquidity injection into the economy.

15:05

πŸ’Ή Projected Liquidity Injection and its Effect on Asset Prices

The final paragraph projects a substantial liquidity increase due to the potential drawdown of the TGA during the 2025 debt ceiling debate. It suggests that this could result in a significant injection of funds into the economy, surpassing the 2008 TARP program's $700 billion. The speaker anticipates that this influx of liquidity could lead to a rise in asset prices across various sectors, including Bitcoin, tech stocks, and real estate. However, they caution that while asset prices may rise, the overall economic health may not necessarily improve, and the increase in money supply could diminish the purchasing power of the dollar.

Mindmap

Keywords

πŸ’‘Market Crash

A market crash refers to a sudden and dramatic drop in stock prices, often indicating a broader economic downturn. In the video, the speaker mentions the fear of an imminent market crash due to various economic indicators and global events, setting a tone of uncertainty and concern for asset prices.

πŸ’‘Economic Indicators

Economic indicators are statistics that inform about economic activity and health. The script references yield curve inversion, weakening unemployment, and slowing home sales as indicators suggesting a potential recession, which are crucial for understanding the broader economic context discussed in the video.

πŸ’‘Asset Prices

Asset prices represent the value of financial instruments or real assets in the market. The video emphasizes that while economic indicators predict the economy's direction, asset prices may not follow suit, highlighting the complexity of market behavior.

πŸ’‘Liquidity

Liquidity refers to the ease with which assets can be bought or sold in the market without affecting their prices. The script discusses how liquidity levels impact asset prices, with higher liquidity typically leading to higher prices and vice versa.

πŸ’‘Treasury General Account (TGA)

The Treasury General Account (TGA) is the account held at the Federal Reserve where the U.S. government's funds are kept. The video explains the TGA's role in affecting market liquidity, with changes in its balance having direct implications for the money supply in the economy.

πŸ’‘Debt Ceiling

The debt ceiling is the legal limit on the amount of national debt the U.S. government can carry. The script discusses the 'debt ceiling showdown,' a political event where the potential for raising this limit leads to debates and can affect government spending and economic policy.

πŸ’‘Extraordinary Measures

Extraordinary Measures refer to the tactics used by the government to continue funding operations when the debt ceiling is reached. In the video, it is mentioned that the government may use the TGA to fund the gap created by the inability to issue more debt during such periods.

πŸ’‘Quantitative Easing (QE)

Quantitative easing is a monetary policy where a central bank creates new money to buy government bonds or other securities to inject liquidity into the economy. The script contrasts this with the direct injection of money into the economy through TGA draining, suggesting different impacts on market liquidity.

πŸ’‘Inflation

Inflation is the rate at which the general level of prices for goods and services is rising, and subsequently, the purchasing power of currency is falling. The video suggests that injecting money into the economy, as might happen with TGA draining, could be inflationary.

πŸ’‘Bitcoin

Bitcoin is a decentralized digital currency that operates without a central bank or single administrator. The speaker advises viewers to secure their Bitcoin, indicating a concern for the stability of digital assets in times of economic uncertainty.

πŸ’‘Asset Allocation

Asset allocation is the process of distributing investments across different asset classes to optimize returns and manage risk. The video implies that understanding the impact of TGA levels on liquidity is crucial for strategic asset allocation, especially in the context of potential economic shifts.

Highlights

Investors are anticipating a significant market crash due to recent market crashes, upcoming elections, and potential wars.

Economic indicators such as yield curve inversion, weakening unemployment, and slowing home sales suggest an imminent recession.

While economic indicators can predict economic trends, they are less effective at predicting asset prices.

The Treasury General Account (TGA) is a key indicator for asset prices, representing the government's bank account at the Federal Reserve.

The TGA's current flatline level, around $770 billion, is unusual and may indicate future market movements.

The mechanics of the TGA affect market liquidity; a full TGA indicates less money available for the market, while a draining TGA suggests an injection of funds into the economy.

Government estimates for TGA levels by the end of Q3 2024 and Q4 2024 may not be accurate, based on historical revisions.

Draining the TGA is akin to deficit spending or quantitative easing, injecting fresh money into the economy.

The process of draining the TGA can increase household net worth, leading to more spending and potentially higher asset prices.

Banks with more reserves can loan out more money, increasing liquidity in the system when the TGA is drained.

The Debt Ceiling Showdown is a significant event that can impact the TGA and, consequently, market liquidity.

During the Debt Ceiling Showdown, the government may use the TGA to fund the gap created by the lack of debt availability.

Historical patterns show that the TGA is often drawn down to about $100 billion during debt ceiling debates.

The potential injection of $750 billion into the economy could have a significant impact on asset prices, similar to the TARP program in 2008.

The upcoming debt ceiling debate in 2025 may follow historical patterns, leading to a decrease in the TGA and an increase in market liquidity.

The increase in liquidity could lead to a rise in asset prices, but may also diminish the purchasing power of dollars.

The video suggests keeping an eye on market movements over the next 9 to 12 months due to potential significant liquidity changes.

Transcripts

play00:00

with the recent crash in markets and the

play00:02

coming election and potential Wars many

play00:04

investors are really scared they're

play00:06

expecting a big market crash to come any

play00:08

day and of course it's no wonder we have

play00:11

many economic indicators like the yield

play00:13

curve inversion weakening unemployment

play00:15

we have slowing home sales and they're

play00:17

all showing us that recession is

play00:19

imminent but while those might be really

play00:22

good indicators of where the economy is

play00:24

going they're not good at showing where

play00:26

asset prices are going and the best

play00:28

indicator for that is right now flashing

play00:30

a giant green arrow well at least you

play00:33

know what you're looking for so in this

play00:34

video I'm going to break down the event

play00:37

that's coming this year in 2024 that's

play00:39

going to have the biggest impact on

play00:41

asset prices and no it's not the

play00:43

election right I'm going to show you the

play00:45

prices I'm going to show you the levels

play00:47

I'm going to show you what's expected to

play00:48

happen but we're going to look at the

play00:49

data we're going to look at the facts of

play00:51

other previous Cycles like the one

play00:53

that's setting up right now now once you

play00:56

see this data and you understand its

play00:58

impact on asset prices markets you're

play01:00

can to have a completely different view

play01:03

uh than you know all the Talking Heads

play01:05

that are pedaling Their Fear for you so

play01:07

let's

play01:08

go all right so jumping right in we are

play01:11

going to look at the money it's always

play01:13

about the money right so we're going to

play01:15

look at the money and as we I talk about

play01:17

all the time now liquidity so liquidity

play01:19

when there's more money in the system

play01:21

more liquidity in the system then prices

play01:23

tend to go up and when there's less

play01:25

liquidity then prices tend to go down

play01:28

now it's very simple but it's it's not

play01:30

it's not that easy to understand all the

play01:32

millions of reasons why pricing go up or

play01:34

down but let's look at a giant one right

play01:36

now and this is the United States

play01:38

government's piggy bank sort of like

play01:40

this a little bit different than you

play01:42

have when you're a kid now of course the

play01:43

government sort of like a business has

play01:45

income right taxes and they have

play01:47

expenses that they spend and they keep

play01:49

the difference their money their piggy

play01:51

bank and they keep it in the bank not

play01:53

Wells Fargo JP Morgan not City Bank they

play01:55

keep it at the Federal Reserve of course

play01:57

all right and this is known as the TGA

play01:59

or what we called the treasury general

play02:01

account right now a lot of people don't

play02:03

know what the TGA is it's the

play02:04

government's bank account okay and what

play02:06

we can see is that uh there's a lot of

play02:09

money sitting in that bank account but

play02:10

the important piece that we're going to

play02:11

break down is how much money is there

play02:14

how has that money been used in the past

play02:17

what have we seen through other types of

play02:19

cycles and what do we expect is going to

play02:22

happen based off of the information

play02:23

they've given us and what's historical

play02:25

now I do want to just give a quick shout

play02:27

out here uh to Thomas uh Thomas right

play02:30

sees great tweet uh threads over on

play02:32

Twitter and so I've taken some of the

play02:34

charts from his Twitter thread we'll

play02:35

link to it down below in the description

play02:37

if if you want to read the entire uh

play02:39

thread that he put together is pretty

play02:41

good but just real quickly uh you can go

play02:43

on to prettyy much anywhere trading view

play02:45

or whatever this is from the FED

play02:46

directly and you can look at the

play02:47

treasury general account now it did get

play02:50

really high in 2020 like everything else

play02:52

did right so you can see we sort of have

play02:54

this Baseline around here this was this

play02:56

2020 anomaly now these red arrows that I

play02:59

put on the screen here here is uh tax

play03:01

time this is April of 20 uh 22 or 21

play03:05

April 22 April 23 and you can see that

play03:08

there's these spikes every year right

play03:10

when we get the when the taxes come in

play03:12

uh but what we can see right now is that

play03:13

this level has pretty much been Flatline

play03:16

here which is sort of rare you can see

play03:18

it's usually pretty volatile right

play03:19

coming in from taxes spending down up

play03:21

from taxes spending down and we've had

play03:23

this pretty flat area there's about

play03:25

$770 billion little less than a trillion

play03:29

we might see some of the Peaks about

play03:31

$770 billion in that now one thing to

play03:34

understand is the mechanics of how this

play03:35

works when the treasury TGA when the

play03:38

treasury account is full cash is out of

play03:41

the market it's on the sidelines it's uh

play03:43

it's dormant as I said right so it's

play03:45

like money in the bank it can be spent

play03:47

whenever they want to spend it but it's

play03:49

not actively incentivizing uh spending

play03:52

at that time now if we look at the TGA

play03:55

treasury general account levels we can

play03:57

start to get a sort of better idea of

play03:59

where things are at now and more

play04:00

importantly where they might go

play04:02

historically now typically you might

play04:04

think that as the TGA account is rising

play04:08

as there's more money piling into that

play04:10

account that's typically bad for

play04:11

liquidity levels so uh you know tax time

play04:14

as I showed you how it starts to spike

play04:16

around tax time well it has to go from

play04:18

my account my personal account my

play04:19

business account or yours to the

play04:21

government and that means that I now

play04:23

have less money to invest into my

play04:24

business or to spend for my family or

play04:27

whatever it is and so that money is

play04:28

being sucked out of of the economy and

play04:30

it's going to the government I like to

play04:32

say that the government cannot give

play04:34

something that it has not taken the

play04:37

government doesn't create all it does is

play04:38

redistribute so it's literally taking it

play04:40

away from you and I productive members

play04:42

of society and it goes into their

play04:44

account so that is typically bad it's

play04:45

sucking liquidity out when we see TGA is

play04:48

draining then that is good for liquidity

play04:52

that means that now the TGA that the

play04:53

government is now pushing the money back

play04:56

onto Main Street because remember the

play04:57

government redistributes they take it

play04:59

from me you from my business and then

play05:01

they give it to whoever they want so

play05:03

they're taking it sucking out giving it

play05:05

back pushing it back so that would be

play05:07

good good for liquidity anyway all right

play05:09

now uh what we can see is the TGA the

play05:12

government estimates where they expect

play05:15

their bank account levels to be so they

play05:17

said that by the end of Q3 2024 they

play05:21

expected to have about 850 billion which

play05:24

is it's about 770 billion right now so

play05:26

they expect the TGA to go up between now

play05:29

and the end of Q3 which is pretty

play05:30

interesting because we don't have any

play05:32

you know big tax dates coming up and

play05:34

they expect by the end of Q4 so by the

play05:36

end of this year to be at about 700

play05:38

billion which is a little bit lower than

play05:41

we're at today now this estimate is

play05:44

completely wrong just like every other

play05:46

estimate the government puts out the

play05:48

treasury also puts out their borrowing

play05:50

requirements every quarter and uh yeah

play05:53

they're wrong every single one they have

play05:54

to go back and revise them when no one's

play05:55

paying attention all the economic data

play05:58

the BLS puts out it's it's always wrong

play06:00

they go back and revise that and these

play06:02

numbers are way off and we're going to

play06:04

take a look at that and why that's

play06:05

important now just to kind of put this

play06:07

into perspective with a chart that you

play06:08

can see again this goes back to the T

play06:10

TGA account and so we're right here at

play06:13

this blue dot and they're expecting that

play06:15

the end of Q3 were here a little bit

play06:19

higher and by Q4 we're here a little bit

play06:22

lower so we're going to stay right in

play06:24

this range apparently according to them

play06:26

now you can just look back here that has

play06:29

not been the case we have not been in a

play06:31

range at all that long but uh that's

play06:33

that's where they say we're at now to

play06:35

get an idea of how this works the TGA

play06:37

account Works let's just break this down

play06:39

U this is from macro Alf and he says

play06:41

right here why does draining the TGA

play06:44

matter that much for markets and the US

play06:46

economy so when the TGA is high it's bad

play06:50

for markets when the TJ is low or

play06:52

drained it's good so why why does it

play06:54

matter for markets in the economy and he

play06:56

says because draining the TGA taking the

play06:58

money and pushing it back into the

play06:59

market is akin to throwing fresh money

play07:02

at the economy just dumping money into

play07:04

the economy similar to deficit spending

play07:07

which we've been doing a lot of that as

play07:08

well so deficit spending as well as TGA

play07:10

spending and also adding new liquidity

play07:13

to the interbank system similar to QE or

play07:16

quantitative easing so this whole time

play07:18

no we're tightening we're tightening no

play07:19

quantitative easing well maybe

play07:21

technically but there's lots of ways

play07:22

that we get liquidity into the system so

play07:25

how does it work well he goes on to say

play07:26

it's sort of like this onew punch so

play07:28

step one is the government drains down

play07:31

its TGA at the Fed so right now 770

play07:34

billion they could drain that money down

play07:37

hence lowering its Equity position but

play07:39

then injecting this fresh new money into

play07:42

the real economy like this is the most

play07:44

inflationary can be uh you know analysts

play07:46

will argue that QE isn't really

play07:48

inflationary because it doesn't really

play07:49

get money into the actual Market or I'm

play07:52

sorry to the economy QE just gives money

play07:54

to the banks but the banks don't

play07:55

necessarily put into the economy

play07:56

supposedly that's a whole another topic

play07:58

for another video but but here it's

play08:00

literally injecting this fresh money

play08:02

directly into the economy that's what

play08:04

the government does the economy equals

play08:07

households net worth goes up household

play08:10

net worth goes up people have more money

play08:11

to spend step number two households now

play08:14

have more money that's good in the form

play08:16

of bank deposits which end up back into

play08:19

the banking system so if you get money

play08:20

where do you put it of course you put it

play08:22

into the bank and hence Banks also sit

play08:24

on a larger amount of reserves so now

play08:26

the banks take the deposits they have

play08:27

more reserves what do banks do when they

play08:29

have more res reserves well how they're

play08:30

able to loan out even more money which

play08:32

means even more liquidity in the system

play08:34

the fed's balance sheet squares with

play08:36

less TGA perfectly offset by a higher

play08:38

amount of reserves so now you can see

play08:40

how powerful this monetary mechanic

play08:42

combination is so when they drain the

play08:45

TGA it's literally throwing money

play08:47

directly into it but they're saying that

play08:49

they're not going to drain it they're

play08:50

saying by the end it's actually going to

play08:52

go up and by the end of the year it's

play08:53

going to be about even that's what they

play08:55

say but uh should we take them at their

play08:57

word or should we understand this a

play08:59

little bit more we just saw the markets

play09:00

go into a tail spin and panic when Japan

play09:02

raised rates and this thing called a

play09:04

carry trade started to unwind now

play09:06

doesn't really matter about that but

play09:07

what we did see was brokerage accounts

play09:09

were frozen and we saw people unable to

play09:10

withdraw their Bitcoin from their

play09:12

exchanges now that was a warning but the

play09:14

reality of that happening is real and so

play09:16

don't trust your Bitcoin on an exchange

play09:19

secure it yourself secure it properly

play09:21

now I know it can seem overwhelming but

play09:23

if you use a device like this it can be

play09:25

very easy this is a treasure Hardware

play09:27

device and basically what this does is

play09:29

keeps your private key secure and when

play09:31

you want to use it you plug it into your

play09:33

computer when you don't want to use it

play09:34

you unplug it and put it back into your

play09:35

safe I've been using this device treer

play09:37

for I don't know six seven years because

play09:40

I think it's the easiest to use and uh

play09:42

if it's complex that creates problems on

play09:44

its own it's easy to use it's fast to

play09:46

really set up and it's open source so

play09:48

you can trust the software on there so

play09:49

check out this treasure device it's the

play09:51

easiest it's the fastest way to secure

play09:53

your Bitcoin take custody of it yourself

play09:56

and protect your private property check

play09:57

it out there's a link down below okay so

play10:00

if we take the historical V view now I

play10:03

want to go back in history to understand

play10:04

where we're going in the future but I do

play10:05

want to just let you know I don't really

play10:07

care about the end of Q3 I don't really

play10:09

care about the end of Q4 typically I'm

play10:11

looking at least a year out most of my

play10:13

stuff I'm looking three five or 10 years

play10:15

out but let's just take a look at where

play10:17

we'll be in 2025 all right so that's

play10:20

sort of what I've been talking about a

play10:21

lot with my qwave thesis this

play10:23

quantitative uh leap that we're taking

play10:25

forward right now is really through the

play10:26

end of 2025 so right now we're looking

play10:28

at that

play10:30

and in if we want to know where we're at

play10:31

in 2025 we have to see well what's going

play10:33

to happen before we get there and

play10:36

there's a really big event coming up

play10:38

that you might have heard of before and

play10:40

this is the debt sealing Showdown uh the

play10:43

government gets together and says we

play10:45

need more debt of course we do because

play10:46

we can't afford the debt we have so we

play10:48

need more debt President Biden was on

play10:49

the news saying well we need to have

play10:51

more debt because uh the US has never

play10:53

defaulted and if we don't get more debt

play10:55

how do we pay the old

play10:56

debt sort of like the definition of a

play10:58

Ponzi scheme so the debt sealing

play11:00

Showdown comes and they argue over if

play11:02

we're going to raise it or not uh both

play11:04

sides grand stand about not wanting to

play11:06

spend more there's some concessions made

play11:09

and every single time it's been raised

play11:11

now there has been sometimes where it's

play11:12

got very close we've seen some credit

play11:14

downgrades because of this but this is

play11:16

basically what happens and in this event

play11:18

it almost always seems to happen it will

play11:20

probably happen this year before the

play11:21

election is that the they can't come to

play11:23

an agreement and so what happens is uh

play11:26

without passing an agreement then

play11:27

there's no more debt available there's

play11:29

no no no more funding available for the

play11:31

government so what happens in that event

play11:33

well don't worry the government has a

play11:35

piggy bank called the TGA during that

play11:38

time they will do what they call

play11:40

Extraordinary Measures and they'll use

play11:43

the government bank account the TGA to

play11:45

actually fund that Gap where they can't

play11:48

get the debt ceiling this happens most

play11:50

of the time now we can see this in this

play11:52

chart right here here's the TGA account

play11:53

again and what we have right here in

play11:55

this first dotted line is where the debt

play11:58

ceiling Showdown begins this is where

play12:00

they start fighting and we can see they

play12:02

start spending down the TGA account down

play12:05

down down down down right here this line

play12:08

right here is where an agreement is

play12:10

finally reached now this time frame is

play12:12

about 140 days now we fast forward the

play12:16

TJ gets replenished kind of has this

play12:19

sideways action and this dotted line

play12:21

right here is where they start fighting

play12:23

about the debt ceiling again we're not

play12:25

going to raise it we need to raise it

play12:26

Etc and then they start spending down

play12:28

the G until they finally make a deal

play12:31

right here about another 140 days now it

play12:35

went up here it goes up it starts

play12:38

walking sideways and this dotted line

play12:40

right here is guess what where the next

play12:43

debt ceiling Showdown is going to begin

play12:45

now what's interesting is this is

play12:47

January of

play12:48

2025 now they predict that the TGA will

play12:51

be higher by the end of the year so

play12:53

maybe it'll be somewhere in this range

play12:56

but when the debt ceiling debate or uh

play12:58

start happening what do you think

play13:00

happens based off of this most likely it

play13:04

starts trending down let me show you

play13:05

another chart this is a little bit

play13:08

different of a historical lens again

play13:10

thanks to Thomas I'm stealing his charts

play13:12

we got these off of Twitter I'm going to

play13:13

link to his full thread down below uh

play13:15

what we can see here is when this

play13:17

happened you can see it dropping right

play13:19

here and each time we got to about 100

play13:23

billion same level and so it's important

play13:25

to understand what happened in this

play13:27

mechanics right here but it's also

play13:29

important to understand the sort of

play13:31

empty level that they draw down to

play13:34

because if we want to know where we end

play13:35

up here what level will we be at about

play13:39

100 billion now 100 billion how much did

play13:42

they say would be in there by the end of

play13:44

the

play13:45

year now we can do some math all right

play13:48

now I also want to show you for

play13:50

historical purposes that this is where

play13:53

the government said we would end up so

play13:56

again we have these dotted lines where

play13:57

the debt ceiling debates started here's

play13:59

where it ended up now what's important

play14:01

is this is where we ended up however

play14:04

what the treasury had forecasted where

play14:06

we end up was right

play14:09

here same thing here we get to here they

play14:12

forecast we would be here but we ended

play14:14

up down here now they're forecasting

play14:17

we're going to be here but where do you

play14:19

think we're going to be well if history

play14:21

is our guide we're going to be right

play14:24

here in this range the same thing now

play14:26

why does all this matter well it matters

play14:30

because we need to figure out where

play14:31

we're going in the form of liquidity and

play14:34

the first thing we have to kind of

play14:35

figure out is where do we go what are

play14:37

the lawmakers going to do now we have to

play14:39

remember as I said take into

play14:41

consideration that we're also in an

play14:42

election year so this is going to make

play14:44

this even more volatile meaning um you

play14:47

know is it going to be Republicans Or

play14:48

democrats are going to take over the

play14:49

presidency who's going to retain the

play14:51

Senate the house I would imagine there's

play14:52

going to be even more Grand standing

play14:54

than we normally see fighting over

play14:56

budgets different parts of the budgets

play14:58

and so if anything this could probably

play15:00

exacerbate the situation it could

play15:03

probably make the treasury fund it for

play15:05

longer than they typically have and if

play15:07

so then they will have to continue to

play15:10

inject the money so the question is how

play15:12

much will they have to inject we know

play15:15

that they're here now we know that they

play15:17

say they might build it up a little bit

play15:20

and the question is how far will they

play15:21

drain it down well back to the math if

play15:24

we're typically down to about a 100

play15:25

billion each time and we have about 800

play15:28

B billion 850 billion they draw it down

play15:31

to 100 that means there's about 750

play15:35

billion that could get injected directly

play15:38

into the economy for you and I to spend

play15:41

so what does that mean well if we have

play15:43

750 billion injected not into the banks

play15:46

like QE I'm talking about being injected

play15:49

directly into the economy directly into

play15:52

stimulus into building programs into

play15:55

more welfare things like that it goes

play15:57

directly to the economy now to put this

play15:58

into perspective just to kind of

play16:00

normalize ourselves because these

play16:02

numbers get so out of whack in 2008

play16:04

during the great financial crash where

play16:07

the entire Global Financial system not

play16:09

just the US Global Financial system was

play16:11

melting down at the same time the FED

play16:13

stepped into action to save the world

play16:15

and at the time it was 700 billion that

play16:18

was spent in this tarp program to do

play16:20

that 700 billion this is more than that

play16:24

and is most likely coming our way in the

play16:27

next couple of months so again what

play16:30

happens if we see this it takes about as

play16:32

we saw history it's about a 140-day

play16:34

process of shoveling this money in 750

play16:37

going directly to Main Street what do

play16:39

you think is going to happen well I put

play16:41

some arrows here this is asset prices

play16:43

now look this is good and bad right I'm

play16:45

not saying the economy is going to be

play16:47

fixed by this now a lot of people that

play16:48

are losing their jobs a lot of

play16:50

businesses that might suffer they're

play16:51

going to get some help right they'll get

play16:52

stimulus that will be coming their way

play16:54

so it's good for them overall it's bad

play16:56

for the economy but for asset prices

play17:00

Bitcoin tech stocks real estate I expect

play17:03

all this to go back up now not

play17:06

everything moves up at the same time and

play17:08

we do have to keep in mind that as more

play17:10

money is created and as more money is

play17:12

injected in the system it just

play17:13

diminishes the purchasing power of those

play17:15

dollars so just because assets are going

play17:18

up doesn't necessarily mean you're

play17:19

getting richer so for example as I break

play17:21

this down in the investing black hole

play17:23

the S&P 500 is basically just keeping

play17:25

your nose above water just barely uh but

play17:28

there's certain assets that will go up

play17:30

one times five times nine times what

play17:33

this liquidity will do um I broke it all

play17:36

down in this other video called the

play17:37

investing black hole I'm not going to go

play17:38

through it right now but if you want to

play17:39

watch the investing black hole video I'm

play17:41

going to put it right up here for you go

play17:42

watch that video because it's really the

play17:44

only place that you should be investing

play17:46

but this is what I'm expecting I'm

play17:47

expecting a massive liquidity increase

play17:50

so don't get tricked don't get faked out

play17:52

over the next month or two the next

play17:53

quarter or two keep your eye on the next

play17:56

uh I don't know 9 months 12 months cuz

play17:58

cuz it's going to be a wild ride let me

play18:00

know what you think about this video in

play18:01

the comments down below of course as

play18:02

always give me a thumbs up if you like

play18:03

it if you don't give me a thumbs down

play18:04

that's okay either way at least tell me

play18:06

what you think in the comments subscribe

play18:07

if you're not already subscribed and

play18:09

that's what I got all right to your

play18:10

success I'm out

Rate This
β˜…
β˜…
β˜…
β˜…
β˜…

5.0 / 5 (0 votes)

Related Tags
Economic IndicatorsMarket AnalysisLiquidity ImpactTGA InsightsAsset PricesDebt CeilingElection ImpactFinancial ForecastInvestment StrategyEconomic Cycles