The 7 Quality Control (QC) Tools Explained with an Example!
Summary
TLDRIn this video, Andy from CQE Academy discusses the Seven QC Tools essential for quality management and problem-solving. He covers each tool, including flow charts, check sheets, Pareto charts, cause-and-effect diagrams, scatter diagrams, histograms, and control charts. Using a practical example involving toaster defects, Andy demonstrates how to apply these tools to identify and address quality issues, ultimately reducing defects by controlling variables like humidity. The video is valuable for those preparing for Green Belt, Black Belt, or CQE exams, as well as professionals seeking to enhance their quality improvement skills.
Takeaways
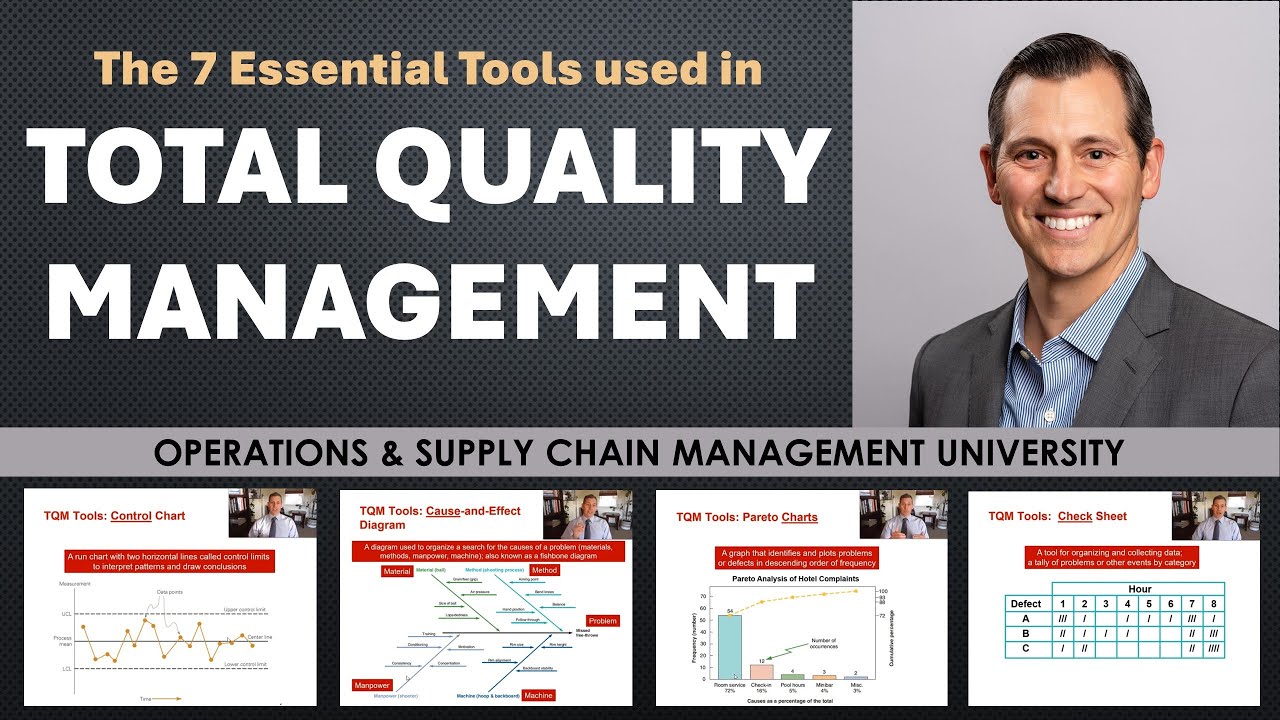
- 🛠️ The video covers the seven QC tools essential for quality improvement and problem-solving.
- 📝 The tools discussed include flow charts, check sheets, Pareto charts, cause and effect diagrams, scatter diagrams, histograms, and control charts.
- 📈 Flow charts visually depict the sequence of a process, promoting a common understanding and simplifying complex processes.
- 📊 Check sheets are vital for collecting, organizing, and analyzing data, ensuring decisions are based on accurate information.
- 📉 Pareto charts help identify the most significant issues by applying the 80/20 rule, focusing on the vital few causes of problems.
- 🐟 Cause and effect diagrams, also known as fishbone diagrams, are used to identify potential root causes of problems through structured brainstorming.
- 🔍 Scatter diagrams illustrate relationships between two variables, helping to determine potential correlations without assuming causation.
- 📅 Histograms display the frequency of data over time, helping to understand process variation and distribution patterns.
- 🔬 Control charts monitor and confirm that processes remain in control by showing data within control limits and detecting any significant changes.
- 📉 Practical example: The video uses a toaster defect problem to demonstrate the application of these tools, highlighting how controlling humidity can reduce defects.
Q & A
What are the seven QC tools discussed in the video?
-The seven QC tools are the flow chart, check sheet, Pareto chart, cause and effect diagram, scatter diagram, histogram, and control charts.
Why are these seven QC tools important according to the video?
-These tools are considered incredibly powerful for solving problems and making improvements, with the claim that 95% of quality problems can be solved with these fundamental tools.
What is the purpose of a flow chart in the QC tools?
-A flow chart is a visual tool that helps depict the flow or sequence of a process, making complex processes simple and promoting a common understanding of the process.
What is a check sheet and how is it used?
-A check sheet is a simple tool for collecting, organizing, and analyzing data. It ensures that decisions are based on data and should include metadata such as who, when, and where the data was collected.
What is the Pareto principle and how does it relate to the Pareto chart?
-The Pareto principle, or the 80/20 rule, states that 80% of problems are often due to 20% of causes. A Pareto chart helps identify these 'vital few' causes so that efforts can be focused on the most significant issues.
What is a cause and effect diagram and what is its purpose?
-A cause and effect diagram, also known as a fishbone diagram or Ishikawa diagram, is used to systematically identify potential causes of a problem and understand the relationship between them.
How can a scatter diagram be used in QC processes?
-A scatter diagram plots pairs of data to identify and analyze the relationship between two variables, helping to understand if and how one variable affects another.
What does a histogram show and why is it useful?
-A histogram is a bar chart that graphs the frequency of occurrence of continuous data, showing the distribution and variation within a process, which helps in understanding process behavior and capability.
How does a control chart help in maintaining process control?
-A control chart monitors the stability of a process over time, ensuring that it remains within control limits and only experiences normal variation, confirming the effectiveness of implemented changes.
What was the specific example used in the video to demonstrate the use of the seven QC tools?
-The example used was reducing the number of defects in a toaster manufacturing process, where the tools were applied to identify and control for high humidity during assembly as a root cause of defects.
Outlines

This section is available to paid users only. Please upgrade to access this part.
Upgrade NowMindmap

This section is available to paid users only. Please upgrade to access this part.
Upgrade NowKeywords

This section is available to paid users only. Please upgrade to access this part.
Upgrade NowHighlights

This section is available to paid users only. Please upgrade to access this part.
Upgrade NowTranscripts

This section is available to paid users only. Please upgrade to access this part.
Upgrade NowBrowse More Related Video

Explaining the Cost of Quality, the 4 Cost Categories and Juran’s Quality Cost Curve

QA vs. QC: Understanding the Key Difference
The Seven Tools of Total Quality Management (TQM)

Project Quality Management

7 Quality Control Tools in Tamil| 7 QC Tools| Six Sigma| 7 Basic Quality Control Tools|
Quality Management System, Quality Assurance, and Quality Control in the Laboratory
5.0 / 5 (0 votes)