Customize Interactive Report using Actions Menu (Sort, Control Break, Highlight) - Part 12
Summary
TLDRThe Tech mining video tutorial guides users on customizing interactive reports through the Actions menu. It covers rearranging columns, sorting data, saving default and alternative reports, utilizing control breaks for grouping, and applying highlight features to display data based on conditions. The tutorial also introduces creating chart and group by views for enhanced report analysis, ensuring viewers can personalize and optimize their report experience.
Takeaways
- 🔄 To customize the interactive report, use the 'Actions' menu at runtime.
- 📝 Click 'Columns' in the 'Actions' menu to rearrange report columns and click 'Apply' to set the new order.
- 🔍 Use the 'Sort' option to order data; for example, sort order numbers in descending order to see the most current orders first.
- 💾 Save your report settings as default via the 'Actions' menu to retain modifications for future sessions.
- 🛠 Developers can create and manage multiple report layouts, including saving, renaming, or deleting alternative reports.
- 📑 Create alternative reports by selecting 'Save Report' under 'Report' and choosing 'Alternative' as the default report type.
- 📊 The 'Control Break' feature allows for grouping reports by one or more columns, such as 'Order Month'.
- 🖍 The 'Highlight' feature enables conditional color-coding of data, e.g., orders over 1000 highlighted in green with red text.
- 🎨 Customize the highlight appearance by setting the background and text colors, as well as the condition for highlighting.
- 📈 In the 'Monthly Review' alternative report, create a chart view and group by view for a summarized representation of data.
- 👨💻 Only developers have the ability to save, rename, or delete alternative reports, ensuring control over report layouts.
Q & A
How can I change the look and feel of the default interactive report in Tech mining?
-You can change the look and feel of the default interactive report by using the actions menu at runtime to modify columns, sorting, and other settings.
What is the first step to arrange the report columns in a specific order?
-The first step is to click the actions menu, select the columns option, and arrange the report columns in the desired order.
How do I apply the changes to the column arrangement?
-After arranging the columns, click the apply button to apply the changes and update the report with the new column order.
What does the 'sort' option in the actions menu allow me to do?
-The 'sort' option allows you to specify the order in which data is displayed, such as sorting by the order number column in descending order.
How can I save my changes to the report settings?
-To save your changes, go to the actions menu, select 'report', then 'save report', and choose 'as default report settings' from the Save list.
What is the purpose of the 'alternative report' feature in Tech mining?
-The alternative report feature enables developers to create multiple report layouts, which can be saved, renamed, or deleted by developers only.
How do I create an alternative report?
-To create an alternative report, select 'save report' under 'report' in the actions menu, choose 'alternative' for the default report type, enter a name for the report, and click apply.
What is the control break feature and how is it used?
-The control break feature allows you to group your report on one or more columns. You enable it by selecting 'format', 'control break', choosing the column to group on, and setting the status to enabled.
How can I highlight data based on a condition?
-You can use the 'highlight' feature in the actions menu to display data in different colors based on a condition. Specify the condition, highlight type, and colors for the background and text.
What are the two types of highlight conditions mentioned in the script?
-The two types of highlight conditions are 'sell', which applies the condition only to the order total column, and 'row', which highlights a complete row based on the condition.
How do I create a chart view and group by view in an alternative report?
-The script does not provide specific steps for creating a chart view and group by view. However, it suggests that these features are part of the actions menu in the alternative monthly review report.
Outlines

This section is available to paid users only. Please upgrade to access this part.
Upgrade NowMindmap

This section is available to paid users only. Please upgrade to access this part.
Upgrade NowKeywords

This section is available to paid users only. Please upgrade to access this part.
Upgrade NowHighlights

This section is available to paid users only. Please upgrade to access this part.
Upgrade NowTranscripts

This section is available to paid users only. Please upgrade to access this part.
Upgrade NowBrowse More Related Video
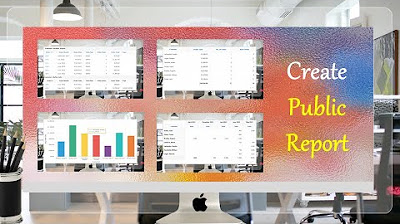
Create Public Report using Actions Menu (Report, Chart, Group By and Pivot) Views - Part 14
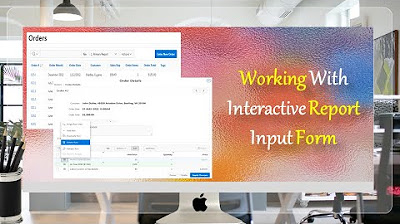
Give a New Look to Interactive Report & Input Form - Part 15(B)

Unity Gorgeous PARALLAX MAIN MENU in 410 Seconds

Looping Through Interactive Grid Oracle APEX - Part 22
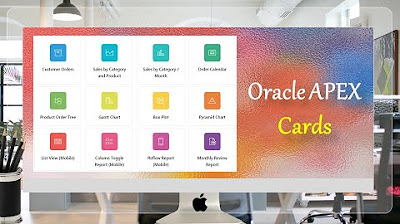
Create Reports List Using Oracle APEX Cards - Part 24

How to create Animations & Interactions with Wix Studio
5.0 / 5 (0 votes)