Line With Area & Bar Charts with Region Display Selector Oracle APEX - Part 27
Summary
TLDRThis Tech mining video tutorial demonstrates creating a graphical report featuring two distinct chart types to represent category sales across various months. Utilizing a region display selector, viewers can toggle between different views of sales data, with interactive charts that update as legend items are selected or deselected. The presentation includes a line chart with area, a bar chart, and tabs for focused or comprehensive regional sales analysis. Detailed instructions and source code are provided for hands-on learning.
Takeaways
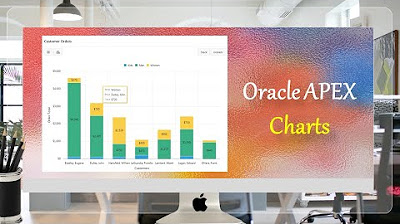
- 📊 The video demonstrates creating two types of charts for presenting category sales data across different months.
- 🖱️ Viewers can interact with the charts by moving the mouse cursor to see sales figures and by deselecting legend items to hide associated data series.
- 🔍 The video introduces a 'region display selector' feature that allows for toggling visibility of different data regions on the page.
- 📈 The first chart type mentioned is a line chart with an area fill, which renders chronological sales data automatically.
- 📊 The second chart type is a bar chart displaying monthly sales data for three specified categories.
- 🗓️ The 'time axis type' property is used to ensure the data is displayed in chronological order on the charts.
- 🔢 The 'show' property controls the visibility of labels and sales figures on the charts, which can be toggled on or off.
- 📑 The video provides the source code for the charts in the description, accessible by opening a specific folder.
- 📝 Titles and date formats are specified for the x-axis, while sales values are labeled in US dollars on the y-axis.
- 📊 The 'show group name' property is used to control the display of group names in tooltips, which can be suppressed if desired.
- 💾 The video concludes with instructions to save progress and test the application to view the interactive charts and tabs.
Q & A
What is the main focus of the Tech mining video?
-The video focuses on creating two different chart types to present category sales in different months using a graphical report with a region display selector.
How does the region display selector function in the graphical report?
-The region display selector allows users to toggle between different views of category sales data, showing or hiding data series on the chart as they move the mouse cursor or deselect items from the legend.
What are the two chart types demonstrated in the video?
-The two chart types are a line chart with an area and a bar chart, both of which display monthly sales data for specified categories.
How can users interact with the charts in the video?
-Users can interact with the charts by moving the mouse cursor over them to see respective sales figures and by deselecting legend items to hide associated data series.
What does the 'show all' tab do in the report page?
-The 'show all' tab, when clicked, displays all the regions in the report, showing a comprehensive view of the sales data across all categories.
How does the 'time axis type' property affect the chart?
-The 'time axis type' property automatically renders the chart data in chronological order, organizing the sales data by month.
What is the purpose of the 'show markers' property in the script?
-The 'show markers' property is used to display markers in the shape of circles on the chart, indicating data points.
How is the visibility of sales figures controlled on the chart?
-The visibility of sales figures is controlled by the 'show' property. Turning it off suppresses the rendering of the label on the chart.
What does the 'show group name' property do in the chart?
-The 'show group name' property specifies whether the group name should be displayed in the tooltip on the chart. It can be turned off to suppress the display of the group name.
How are the sales values displayed on the y-axis of the chart?
-Sales values are displayed as currency in US dollars on the y-axis of the chart.
What is the source code provided in the video description used for?
-The source code provided in the video description is used to create the charts and graphical report as demonstrated in the video, and can be accessed by opening the part 8 folder.
Outlines

This section is available to paid users only. Please upgrade to access this part.
Upgrade NowMindmap

This section is available to paid users only. Please upgrade to access this part.
Upgrade NowKeywords

This section is available to paid users only. Please upgrade to access this part.
Upgrade NowHighlights

This section is available to paid users only. Please upgrade to access this part.
Upgrade NowTranscripts

This section is available to paid users only. Please upgrade to access this part.
Upgrade NowBrowse More Related Video
Oracle APEX Chart | Stack Unstack | Horizontal Vertical Orientation - Part 25

Faceted Search In Oracle APEX - Part 37
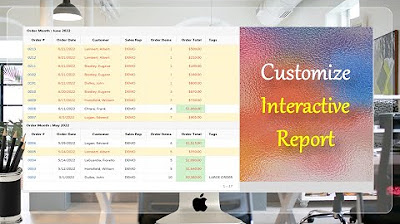
Customize Interactive Report using Actions Menu (Sort, Control Break, Highlight) - Part 12
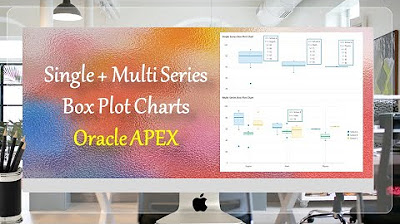
Single + Multiple Series Box Plot Charts Oracle APEX - Part 31
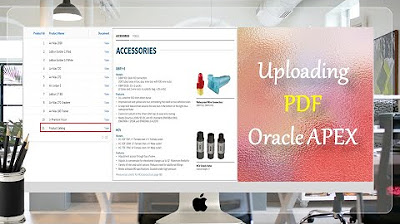
How to Upload PDF, Audio, Video, and other Documents in Oracle APEX - Part 9
Create Advance PDF Reports in Oracle APEX Comprising Grouping | Chart | Pivot Table - Part 33
5.0 / 5 (0 votes)