Make an AWESOME Tableau Dashboard in Only 10 Minutes
Summary
TLDRIn this instructional video, Andy demonstrates how to create an interactive sales dashboard in Tableau within 10 minutes. He guides viewers through building essential charts, customizing their appearance, arranging them in a dashboard with containers, and adding interactivity for a comprehensive visual analytics experience. The tutorial covers filtering data, designing KPIs, mapping sales by country, and line charts for monthly sales, all tailored to a European company's sales tracking needs.
Takeaways
- 📊 The video provides a step-by-step guide to creating an interactive dashboard in Tableau within 10 minutes.
- 🔍 The process begins with building charts and then customizing their appearance to match a specific look.
- 🗺️ A map chart is created to visualize sales by country, with customization of colors to match the company's branding.
- 📈 KPIs such as monthly sales, profit, and customer count are displayed in a clear and concise manner with horizontal alignment.
- 📝 A line chart is constructed to represent sales by month, with options to customize the appearance and interactivity.
- 🎨 Custom colors are applied to the charts to enhance visual appeal and align with the company's color scheme.
- 📐 The use of containers in the dashboard helps to organize and align the charts effectively.
- 🔑 Interactivity is added to the dashboard by enabling filters that allow users to select specific months or products and see corresponding changes in the data.
- 📑 The script includes instructions on how to format text, borders, and backgrounds to create a polished and professional look.
- 🔗 The video creator, Andy, provides additional resources in the description for further learning about Tableau features like containers.
- 💻 The video is aimed at helping viewers become proficient in Tableau, with the final result being a visually appealing and functional sales dashboard.
Q & A
What is the main goal of the video?
-The main goal of the video is to demonstrate how to create an interactive dashboard in Tableau within 10 minutes.
Who is the presenter of the video?
-The presenter of the video is Andy, who created the channel to help viewers become proficient in Tableau.
What are the three main steps to customize the charts in the dashboard?
-The three main steps to customize the charts are: building the charts, customizing them to achieve the desired look, and placing them in the dashboard using containers.
What type of company is the scenario based on in the video?
-The scenario is based on a European company that needs to build a sales dashboard.
What are the key elements tracked by the sales dashboard mentioned in the video?
-The sales dashboard tracks monthly sales, KPIs, top-selling products, and the performance of different regions.
How does the video guide the user to filter the data to the latest year?
-The video instructs the user to drag the 'Order Date' to the filters, select the latest year, and apply this filter to all worksheets to ensure it applies to every new sheet created.
What is the first chart that the video guides the user to build and what does it display?
-The first chart built in the video is a KPI chart that displays sales, profit, and the number of customers.
How does the video suggest customizing the map chart to match the company's color scheme?
-The video suggests changing the default color of the 'Sales' field to a company-specific blue color by accessing the default properties and selecting a standard blue color.
What is the purpose of using containers in the dashboard as shown in the video?
-Containers are used in the dashboard to have more control over the alignment and layout of the sheets within the dashboard.
How does the video guide the user to add interactivity to the dashboard?
-The video shows how to add filters to the 'Sales by Month' and 'Sales by Product' sheets so that selecting an item in one chart updates the others, creating an interactive experience.
What is the final step described in the video for completing the dashboard?
-The final step is to add a bit of interactivity by enabling filters on the charts so that selecting a category in one chart will update the others, and ensuring the dashboard has a clean and polished look with appropriate formatting and borders.
Outlines

This section is available to paid users only. Please upgrade to access this part.
Upgrade NowMindmap

This section is available to paid users only. Please upgrade to access this part.
Upgrade NowKeywords

This section is available to paid users only. Please upgrade to access this part.
Upgrade NowHighlights

This section is available to paid users only. Please upgrade to access this part.
Upgrade NowTranscripts

This section is available to paid users only. Please upgrade to access this part.
Upgrade NowBrowse More Related Video
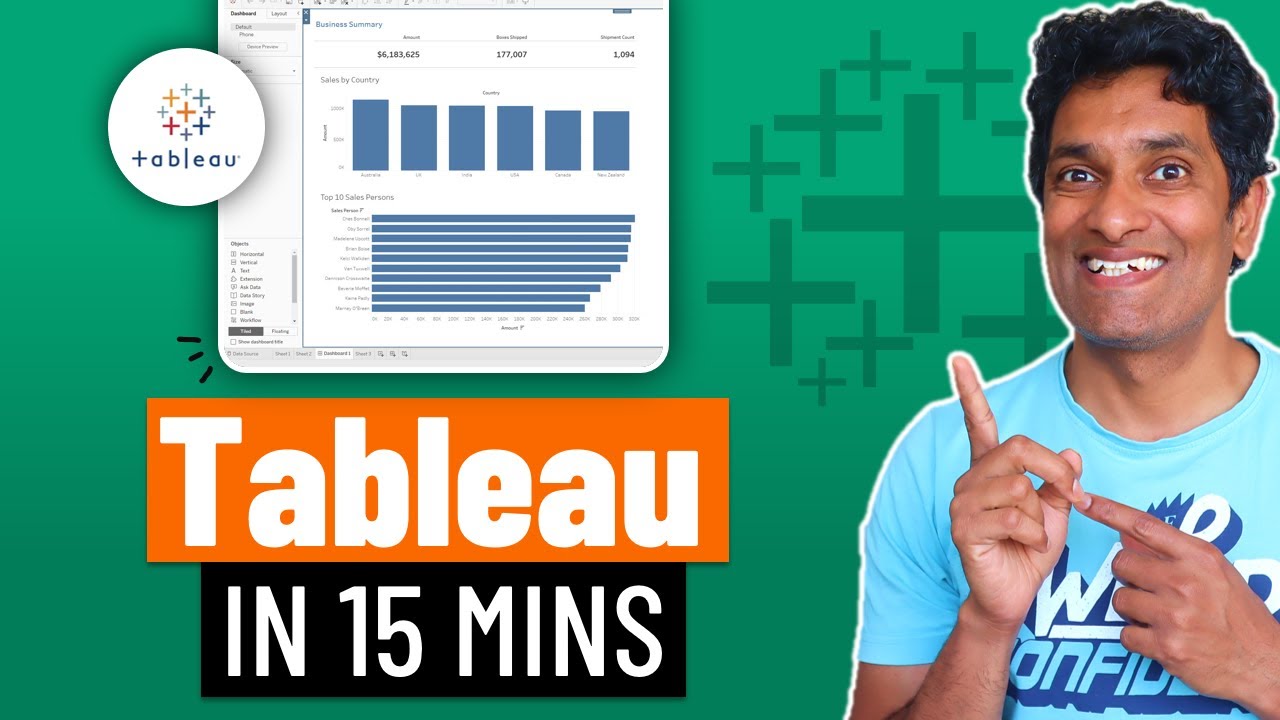
Learn Tableau in 15 minutes and create your first report (FREE Sample Files)
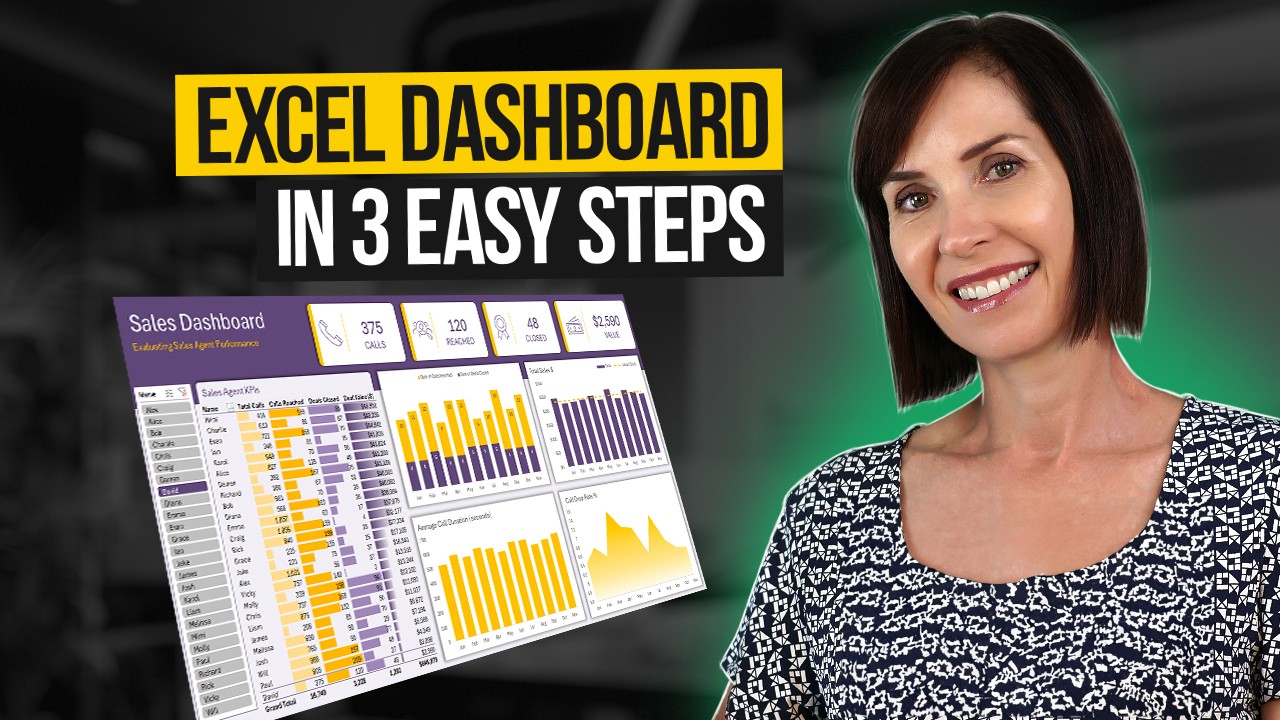
Interactive Excel Dashboard Tutorial in 3 Steps (+ FREE Template)

Tableau Dashboard Tutorial dalam 12 Menit | Bahasa Indonesia
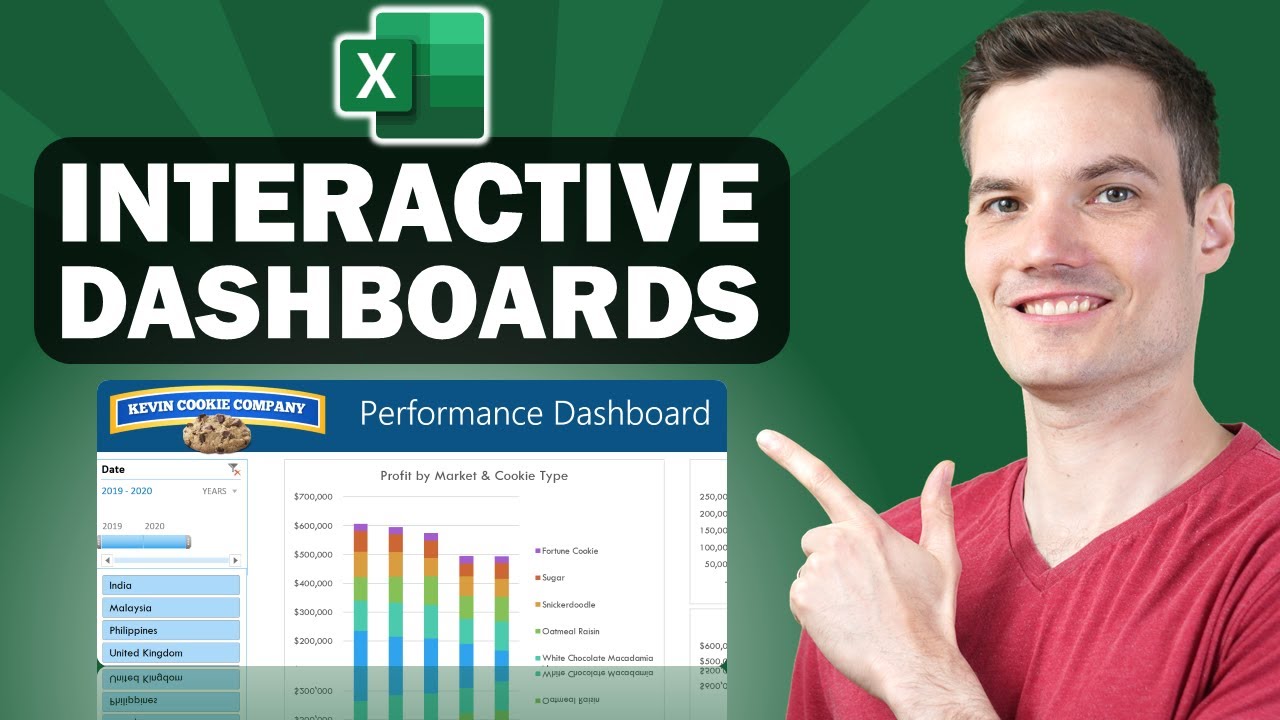
📊 How to Build Excel Interactive Dashboards

Getting Started With Using Maps In Tableau | Tableau Maps For Beginners | Data Deep Dive

Tableau - Dashboard Webpage
5.0 / 5 (0 votes)