06 Paired Samples t-Tests in SPSS – SPSS for Beginners
Summary
TLDRThis video from the RStats Institute at Missouri State University is the sixth in a series on SPSS for beginners, focusing on the paired samples t-test. It explains how to compare two related means, such as before-and-after measurements, using a within-subjects design. The video demonstrates the process in SPSS, including setting up the test, interpreting the output, and understanding the significance of the t-value and p-value. It also clarifies the concept of confidence intervals and the importance of accurate measurement despite the example's limitations.
Takeaways
- 📚 The video is part of a series on SPSS for Beginners by the RStats Institute at Missouri State University, focusing on comparing two means from the same sample in a within-subjects design.
- 🔍 The method demonstrated is the paired samples t-test, used to compare two related means, such as before and after measurements on the same group of subjects.
- 📈 The example provided involves a flawed comparison between height in inches and weight in pounds, illustrating the importance of using comparable measurement scales.
- 📊 To perform a paired samples t-test in SPSS, one must select the appropriate variables and follow the steps under Analyze -> Compare Means -> Paired Samples t-Test.
- 📝 The output of the test includes descriptive statistics, correlation coefficient, and inferential statistics, with the latter being the focus for determining statistical significance.
- 🔢 The t-value, degrees of freedom, and p-value are critical in the inferential statistics table to assess whether the means are significantly different.
- 🚫 A significant result is indicated by a t-value greater than the critical value from the t-distribution table, a p-value less than .05, and a confidence interval that does not cross zero.
- 🔄 The negative t-value signifies that the second group's mean is higher than the first, but the sign does not affect the interpretation of the results.
- 📉 The confidence interval provides a range where the mean difference is likely to fall 95% of the time, offering a more certain but less precise measure than the mean difference itself.
- 🔄 Reversing the order of variables in the t-test does not change the output significantly, except for the direction of the confidence interval and the sign of the t-value.
- 📝 For a proper application of the paired samples t-test, it is recommended to watch additional videos from the RStats Institute for a deeper understanding of statistical theory, test setup, result interpretation, and APA style reporting.
Q & A
What is the focus of the sixth video in the SPSS for Beginners series from the RStats Institute?
-The focus of the sixth video is to demonstrate how to compare two means from two measurements of the same sample using a paired samples t-test in SPSS, which is also known as a within-subjects design or a repeated measures design.
What is a paired samples t-test used for in SPSS?
-A paired samples t-test in SPSS is used to compare two related means, such as in a before-and-after design, where the same sample is measured twice under different conditions.
How is the data set in the video example structured for the paired samples t-test?
-The data set in the video example has a single sample measured twice, which could be a before-and-after scenario or two different measurements of the same group, such as height and weight.
What is the fundamental flaw in comparing height and weight as demonstrated in the video?
-The fundamental flaw in the example is that height is measured in inches and weight in pounds, which means two completely different measurement scales are being compared.
What is the correct approach to measure the effect of a calorie-restricted diet on weight?
-The correct approach would be to measure the weight before starting the diet and then again six weeks later to see if there has been weight loss.
What are the steps to perform a paired samples t-test in SPSS according to the video?
-The steps are to go to Analyze -> Compare Means -> Paired Samples t-Test, select the variables to compare, and then click OK to run the test.
What does the first table in the SPSS output of a paired samples t-test show?
-The first table contains descriptive statistics for each variable, including the mean, sample size, standard deviation, and standard error of the mean.
Why is the correlation coefficient displayed in the output, even though it's not needed immediately?
-The correlation coefficient is displayed because it will be used later when calculating the effect size, which provides additional insight into the strength of the relationship between the two variables.
How can you determine if the means from the paired samples t-test are statistically significantly different?
-You can determine if the means are statistically significantly different by checking if the t-value is greater than the critical value from the Student's t Table, if the p-value is less than .05, or if the 95% confidence interval does not cross zero.
What does the negative t-value in the example indicate?
-The negative t-value indicates that the second group (in this case, weight) had a higher mean than the first group (height). The sign of the t-value does not affect the interpretation of the results.
What is the purpose of a confidence interval in the context of a paired samples t-test?
-A confidence interval provides a range in which the mean difference is likely to fall 95% of the time, indicating the level of certainty around the mean difference while accounting for potential variability in the data.
Outlines

This section is available to paid users only. Please upgrade to access this part.
Upgrade NowMindmap

This section is available to paid users only. Please upgrade to access this part.
Upgrade NowKeywords

This section is available to paid users only. Please upgrade to access this part.
Upgrade NowHighlights

This section is available to paid users only. Please upgrade to access this part.
Upgrade NowTranscripts

This section is available to paid users only. Please upgrade to access this part.
Upgrade NowBrowse More Related Video
07 Independent Samples t-Tests in SPSS – SPSS for Beginners
05 One-Sample t-Tests in SPSS – SPSS for Beginners
08 Next Steps Using SPSS – Conclusion of SPSS for Beginners

Paired-Samples T Test - Pertemuan 9

03 Descriptive Statistics and z Scores in SPSS – SPSS for Beginners
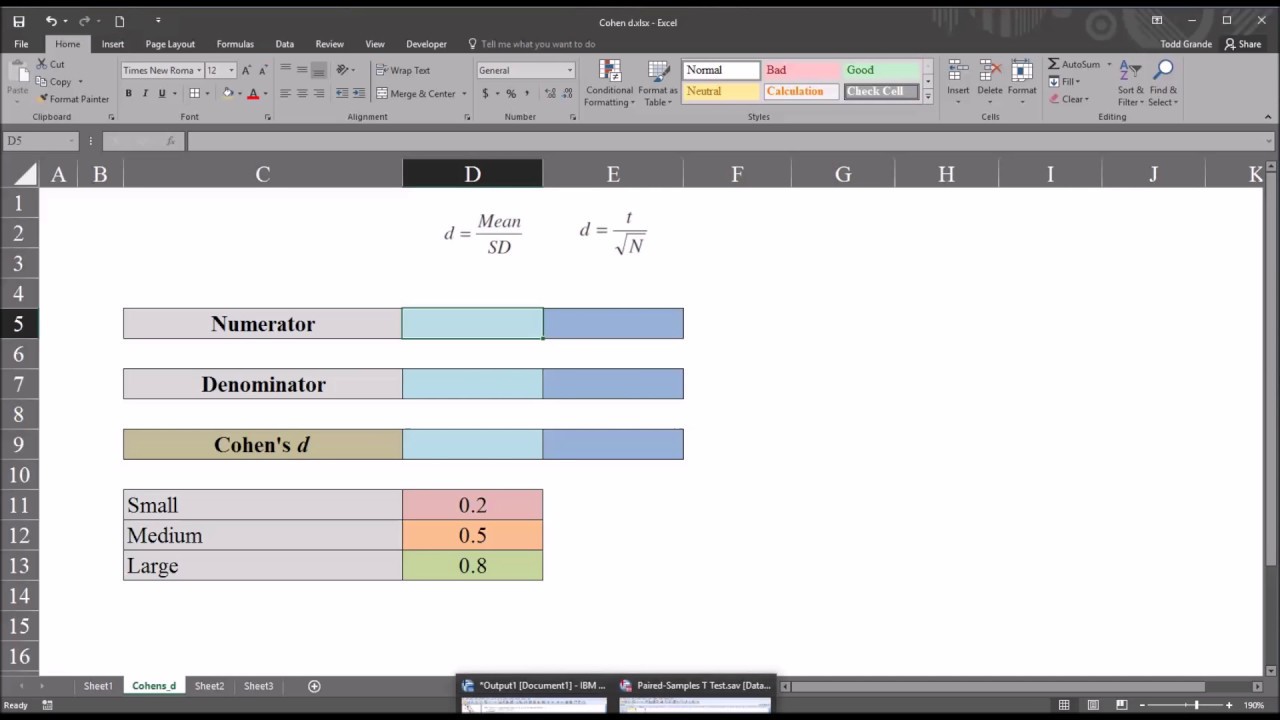
Calculating Effect Size (Cohen's d) for a Paired-Samples T Test
5.0 / 5 (0 votes)