Paired-Samples T Test - Pertemuan 9
Summary
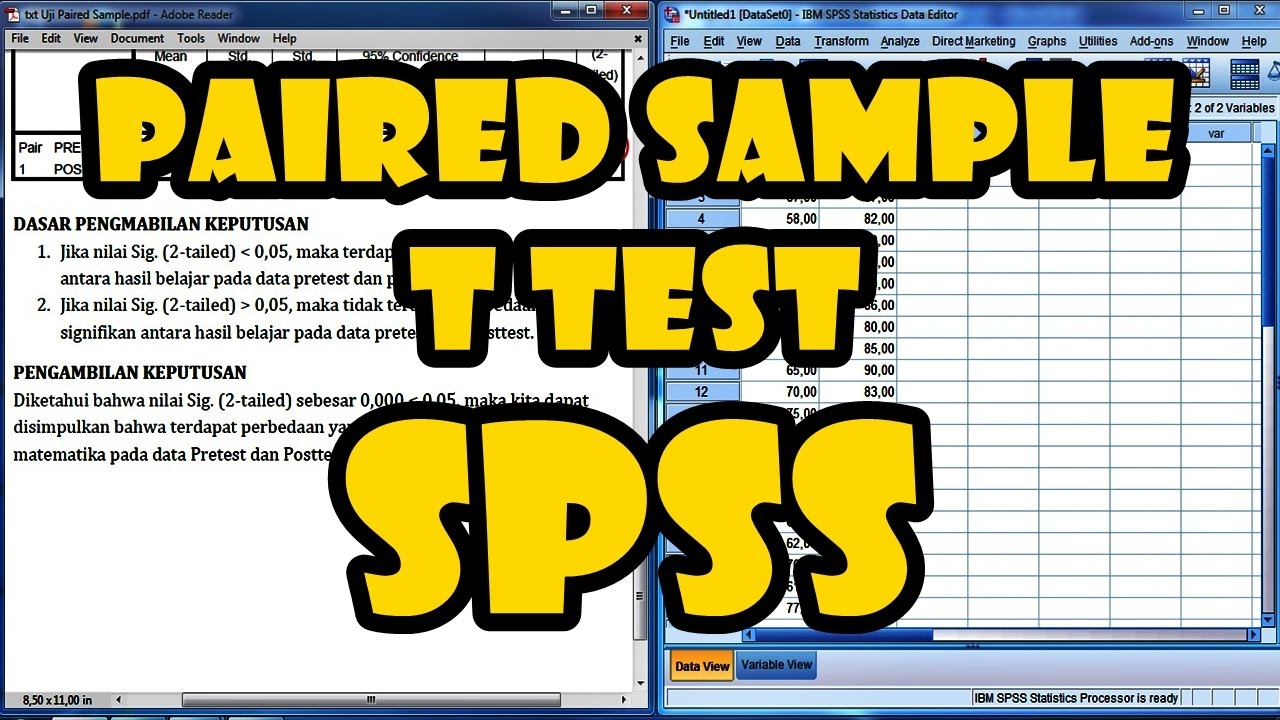
TLDRIn this video, the speaker, Puspa Nurafifah, demonstrates how to perform a paired t-test using SPSS to compare pretest and posttest results. She explains the concept of paired samples and emphasizes the importance of ensuring normality in the data before proceeding with the test. The tutorial walks through the steps in SPSS, showing how to calculate descriptive statistics, check correlations, and interpret the significance value. If the p-value is below 0.05, the difference between pretest and posttest is statistically significant. The video is a practical guide for anyone looking to analyze paired data in SPSS.
Takeaways
- 😀 The paired t-test is used to determine if there is a significant difference between two related samples, such as pretest and posttest scores.
- 😀 Before performing the paired t-test, it is essential to check if the data follows a normal distribution.
- 😀 SPSS can be used to perform the paired t-test, and it requires checking descriptive statistics and exploring the distribution of data first.
- 😀 The paired t-test compares the means of two related samples, such as the pretest and posttest scores of the same students.
- 😀 A significant result from the paired t-test indicates a meaningful difference between the two samples, while an insignificant result means no significant difference.
- 😀 For normal distribution, SPSS provides a 'Descriptive Statistics' option to explore the data before running the paired t-test.
- 😀 A correlation output in SPSS helps to determine the relationship between the two variables, with a significant correlation indicating a meaningful link between them.
- 😀 A p-value of less than 0.05 in the paired t-test output indicates a significant difference, while a p-value greater than 0.05 suggests no significant difference.
- 😀 The correlation between pretest and posttest should be examined; if the p-value is less than 0.05, the correlation is considered significant.
- 😀 The script concludes that if the p-value from the paired t-test is below 0.05, it confirms a significant improvement after teaching, making the teaching process effective.
- 😀 The final conclusion should be based on the significance of the p-value, which informs whether or not the teaching method led to a meaningful improvement in student performance.
Q & A
What is the primary focus of the video?
-The video focuses on explaining the paired t-test using SPSS, a statistical method to determine if there is a significant difference between the pretest and posttest scores of students after teaching them a subject.
What is a paired t-test, and when is it used?
-A paired t-test is used to compare two related groups or samples, often the same subjects measured at two different times, to see if there is a significant difference between them. In this case, it compares pretest and posttest scores.
What is the first step before conducting the paired t-test?
-The first step is to check if the data is normally distributed. This is essential because the paired t-test assumes that the data follows a normal distribution.
How does one check if the data is normally distributed using SPSS?
-In SPSS, you can check the normality of the data by selecting 'Descriptive Statistics' and then using the 'Explore' function to examine if the data follows a normal distribution.
What does a p-value less than 0.05 indicate in the paired t-test?
-A p-value less than 0.05 indicates that the difference between the two sets of data (pretest and posttest) is statistically significant, meaning the change in scores is not due to random chance.
How are the pretest and posttest data handled in the paired t-test?
-Both pretest and posttest data come from the same group of subjects. The paired t-test compares the two data sets to determine if there is a significant change between them.
What is the significance of the correlation output in the paired t-test?
-The correlation output shows the relationship between the pretest and posttest scores. A significant correlation (with a p-value less than 0.05) indicates that the two sets of scores are related and that the paired t-test results are meaningful.
What are the three methods to determine significance in a t-test as mentioned in the video?
-The three methods to determine significance in a t-test are: 1) the p-value, 2) comparing the t-value (t-hitung) with the critical value, and 3) using a curve (graphical method).
Why is it important to ensure the sample data is randomly selected?
-Random selection helps ensure that the data is representative of the broader population, reducing bias and making the results of the t-test more generalizable and valid.
What conclusion can be drawn if the significance value is greater than 0.05 in the paired t-test?
-If the significance value is greater than 0.05, it means there is no significant difference between the pretest and posttest scores, suggesting that the teaching intervention may not have had a measurable effect.
Outlines

This section is available to paid users only. Please upgrade to access this part.
Upgrade NowMindmap

This section is available to paid users only. Please upgrade to access this part.
Upgrade NowKeywords

This section is available to paid users only. Please upgrade to access this part.
Upgrade NowHighlights

This section is available to paid users only. Please upgrade to access this part.
Upgrade NowTranscripts

This section is available to paid users only. Please upgrade to access this part.
Upgrade NowBrowse More Related Video


5.0 / 5 (0 votes)