Measure of Central Tendency of Grouped Data for beginners
Summary
TLDRThis tutorial provides a beginner-friendly guide to calculating the mean, median, and mode of grouped data using a frequency table. It explains how to determine mid-values for class intervals, calculate the mean with the formula ΣfX/Σf, and find the median using cumulative frequencies and class boundaries. The video also details identifying the modal class to compute the mode with the appropriate formula, including adjustments for differences in frequencies between classes. Step-by-step examples and clear calculations are provided throughout, making it easy for learners to follow and understand how to summarize grouped data effectively.
Takeaways
- 😀 The tutorial explains how to calculate the mean, median, and mode for grouped data.
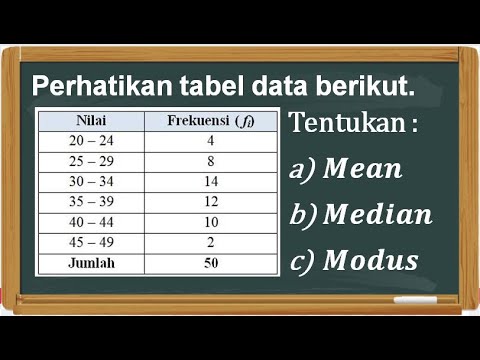
- 📊 To calculate the mean, you first determine the mid-values (X) of each class interval.
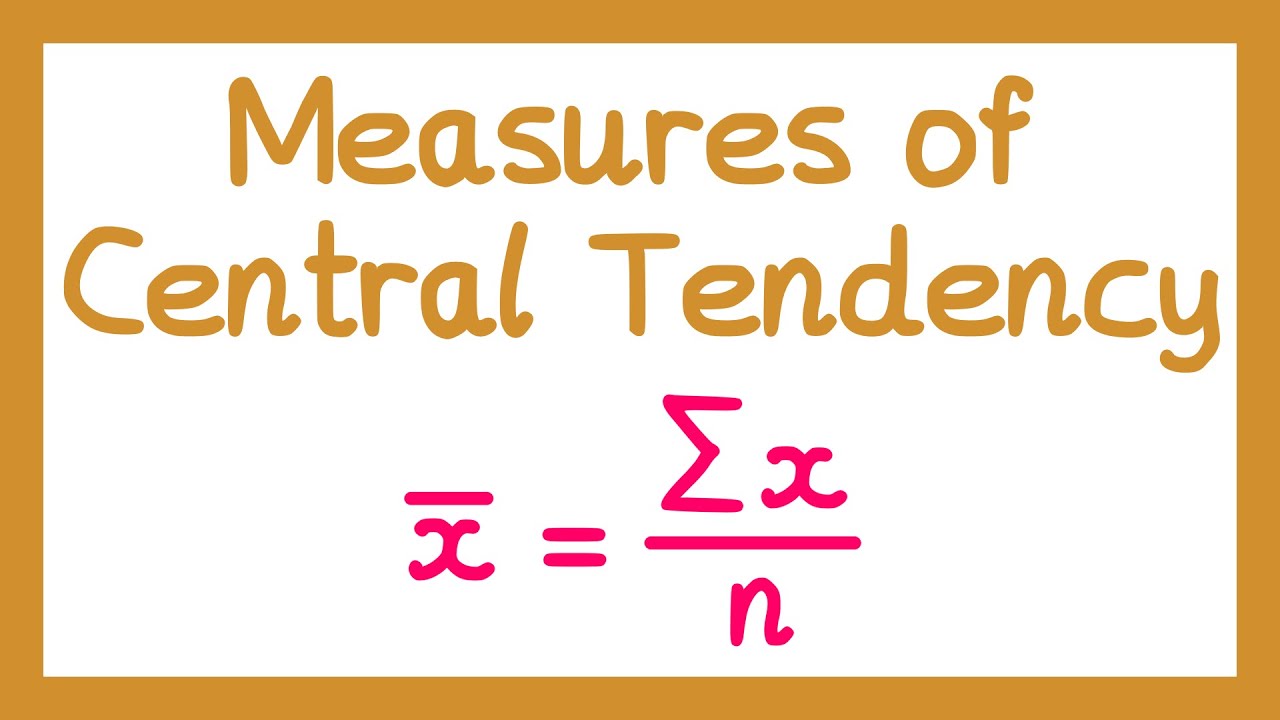
- ➗ The mean is calculated using the formula: sum of (frequency × mid-value) divided by the sum of frequencies.
- 🧮 The mid-value of a class interval is found by averaging its lower and upper boundaries.
- 📈 For the median, you need to identify the median class based on cumulative frequency.
- ✏️ The median formula incorporates the lower boundary of the median class, cumulative frequency before it, frequency of the median class, and class width.
- 📌 Lower class boundaries are calculated as the average of the upper limit of the previous class and the lower limit of the current class.
- 🏆 The mode is determined from the modal class, which has the highest frequency in the dataset.
- ⚖️ Mode calculation uses the difference between the modal class frequency and the frequencies of the classes before and after it.
- ✅ The tutorial demonstrates step-by-step computations for mean (41.5), median (41.75), and mode (43) with a sample frequency table.
- 📚 Understanding the stepwise approach helps beginners accurately handle grouped data and statistical formulas.
Q & A
What is the purpose of the video tutorial?
-The video tutorial aims to teach beginners how to calculate the mean, median, and mode of grouped data.
How is the mid-value (X) of a class interval calculated?
-The mid-value is calculated by adding the lower and upper limits of the class interval and dividing the sum by 2.
How do you calculate the mean of grouped data?
-To calculate the mean, multiply each class mid-value (X) by its frequency (F) to get FX, sum all FX values, and then divide by the sum of the frequencies.
What are the steps to determine the lower class boundary for a class interval?
-To find the lower class boundary, calculate the midpoint between the upper limit of the previous interval and the lower limit of the current interval.
How is the cumulative frequency calculated?
-Cumulative frequency is calculated by adding each class's frequency to the sum of the frequencies of all preceding classes.
How do you identify the median class in grouped data?
-The median class is the class interval whose cumulative frequency is just greater than half of the total frequency.
What is the formula to calculate the median of grouped data?
-Median = L + [(N/2 - CF) / f] × W, where L is the lower boundary of the median class, N is the total frequency, CF is cumulative frequency before the median class, f is the frequency of the median class, and W is the class width.
How do you determine the modal class?
-The modal class is the class interval with the highest frequency.
What is the formula to calculate the mode in grouped data?
-Mode = L + [Δ1 / (Δ1 + Δ2)] × W, where L is the lower boundary of the modal class, Δ1 is the difference between the frequency of the modal class and the class before it, Δ2 is the difference between the frequency of the modal class and the class after it, and W is the class width.
Why do we calculate Δ1 and Δ2 when finding the mode?
-Δ1 and Δ2 measure the difference in frequency between the modal class and its neighboring classes, which helps in estimating the exact location of the mode within the modal class interval.
What were the calculated mean, median, and mode in the tutorial example?
-For the given age distribution, the mean is 41.5, the median is 41.75, and the mode is 43.
Outlines

This section is available to paid users only. Please upgrade to access this part.
Upgrade NowMindmap

This section is available to paid users only. Please upgrade to access this part.
Upgrade NowKeywords

This section is available to paid users only. Please upgrade to access this part.
Upgrade NowHighlights

This section is available to paid users only. Please upgrade to access this part.
Upgrade NowTranscripts

This section is available to paid users only. Please upgrade to access this part.
Upgrade NowBrowse More Related Video
Menentukan Mean, Median, dan Modus Data Kelompok

Cara menyusun tabel distribusi frekuensi, menentukan mean, median dan modus data kelompok
Measures of Central Tendency - Year 1 Statistics [A-level]

mean median modus data tunggal dalam bentuk tabel
Ukuran Pemusatan Data Kelompok

Statistika Dasar Ukuran Pemusatan Data (Mean, Modus, Median) Data Tunggal dan Data Kelompok
5.0 / 5 (0 votes)