Vocabulary for Describing Graphs and Charts
Summary
TLDRThis video provides essential vocabulary and sentence structures to effectively describe data in graphs, charts, and tables. It covers key terms for upward, downward, and stable trends, such as 'increase', 'rise', 'drop', and 'stabilize'. The video also introduces useful sentence patterns for academic writing, such as using subjects with verbs and adverbs or nouns. Additionally, it demonstrates how to use prepositions like 'from...to...' and 'between...and...' to describe changes. A variety of practical examples are given to help viewers enhance their writing and description skills in graph-based contexts.
Takeaways
- 📈 Use verbs like 'increase', 'rise', 'go up', 'grow', 'climb', and 'peak' to describe upward trends in graphs and charts.
- 📉 Use verbs like 'decrease', 'fall', 'go down', 'drop', 'decline', and 'bottom out' to describe downward trends.
- ⚖️ To describe data that stays the same, use terms such as 'stabilize', 'remain constant', or 'stay the same'.
- 🕰️ When describing completed data in charts, use the past tense (e.g., 'Prices rose sharply' instead of 'Prices rise sharply').
- 🏔️ The term 'peak' refers to the highest point on a graph, while 'bottom out' refers to the lowest point.
- 💬 Use adverbs like 'sharply', 'gradually', and 'dramatically' to describe how quickly or slowly changes occur.
- 🧩 Two useful sentence structures for describing data are: (1) subject + verb (+ adverb), and (2) 'There was a(n) + adjective + noun + in ...'.
- 🔢 Prepositions such as 'from ... to ...', 'between ... and ...', and 'to' are used to show changes or ranges in data values.
- 📊 Approximation words like 'approximately', 'around', 'about', 'roughly', 'nearly', and 'almost' help describe estimated figures.
- 🪶 Typical opening phrases include 'The graph shows ...', while conclusion phrases can start with 'From the information given, it can be concluded that ...'.
- 🧠 Converting verbs to nouns (e.g., 'increase' → 'an increase') and adverbs to adjectives (e.g., 'dramatically' → 'dramatic') allows for more sentence variety.
- 📝 Combining multiple descriptions in one sentence (e.g., 'Prices increased from April to May, stabilized through June, and rose sharply again in July') creates smooth and natural summaries.
Q & A
What vocabulary is useful for describing data that shows an increase?
-Useful vocabulary for describing an increase includes 'increase', 'rise', 'go up', 'grow', 'climb', and 'peak'.
Which words should be used to describe data that is going down?
-To describe data going down, you can use 'decrease', 'fall', 'go down', 'drop', 'decline', and 'bottom out'.
What terms can be used when describing data that remains constant?
-When data remains constant, you can use 'stabilize' or 'remain constant'.
How should you describe the highest point in a graph or chart?
-The highest point on a graph or chart is described as the 'peak'. For example, 'Prices peaked at $70 at the beginning of June.'
What is the purpose of using the past tense when describing graphs or charts?
-The past tense is used when describing data that is already completed, as the information being presented is from the past.
How can you use 'approximately' in a sentence about data?
-The word 'approximately' can be used to describe estimated values, such as 'The total sales were approximately $5 million last year.'
What sentence structure can be used to describe changes in graphs or charts?
-A useful sentence structure is 'subject + verb' (e.g., 'Profit increased last year') or 'subject + verb + adverb' (e.g., 'Profit increased dramatically').
What does 'bottom out' refer to in a chart or graph?
-'Bottom out' refers to the lowest point of the graph or chart, where the data reaches its minimum value.
Can you explain how to describe a sharp decline in data using a sentence structure?
-To describe a sharp decline, you can use the sentence pattern 'there was a sharp fall in [data]' or 'prices fell sharply from $X to $Y.'
How can you describe data moving between two points in a scale?
-To describe data moving between two points, you can use the phrase 'fluctuated between [X] and [Y].' For example, 'The market share fluctuated between 20% and 35% in the second quarter.'
Outlines

This section is available to paid users only. Please upgrade to access this part.
Upgrade NowMindmap

This section is available to paid users only. Please upgrade to access this part.
Upgrade NowKeywords

This section is available to paid users only. Please upgrade to access this part.
Upgrade NowHighlights

This section is available to paid users only. Please upgrade to access this part.
Upgrade NowTranscripts

This section is available to paid users only. Please upgrade to access this part.
Upgrade NowBrowse More Related Video
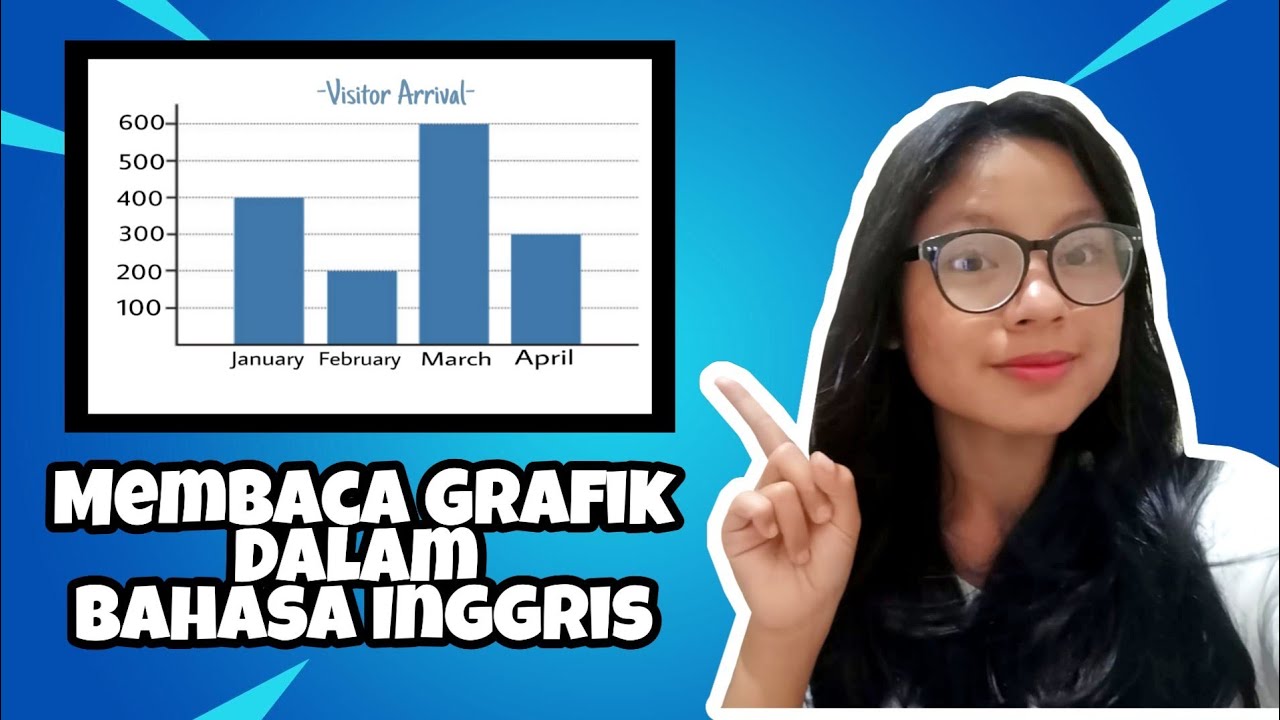
Membaca Grafik Dalam Bahasa Inggris || Eni Kesuma

Video Pembelajaran Matematika Kelas 7 SMP ( Pengolahan Data )

Penyajian Data (Part-1) ~ Tabel dan Diagram (Materi PJJ Kelas VII / 7 SMP)
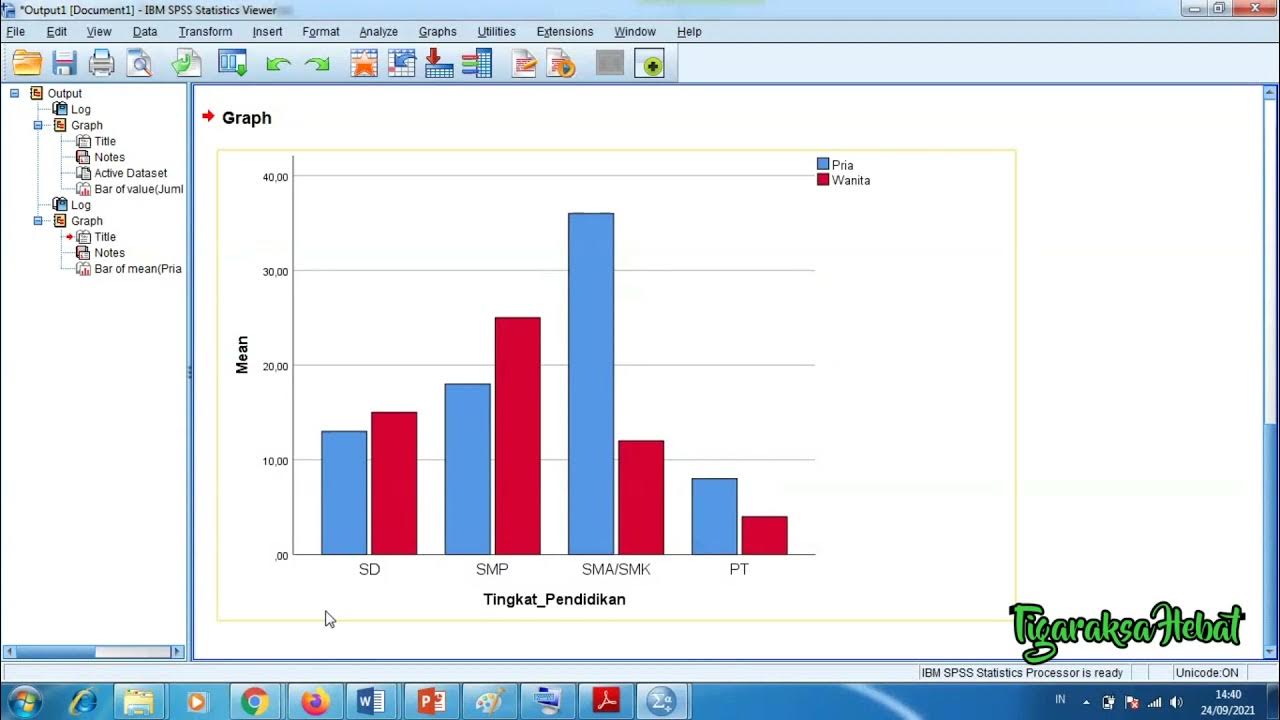
Penyajian Data Statistik Menggunakan SPSS

How to talk about charts and graphs in English (advanced English lessons)
Statistika - Penyajian Data Eps.2 l Ruang Belajar #StudyWithDiida
5.0 / 5 (0 votes)