Power BI Tutorial For Beginners | Create Your First Dashboard Now (Practice Files included)
Summary
TLDRThis Power BI tutorial introduces beginners to the essential steps of creating a dashboard. It covers installing Power BI, importing data from various sources like Excel and CSV files, and transforming the data using Power Query. The tutorial demonstrates how to create relationships between tables, build visuals like charts and maps, and apply time intelligence features like year-over-year comparisons and year-to-date calculations. It also shows how to publish reports, share them via Teams, and offers tips on using Power BI's functionalities for effective data analysis and reporting. By following along, users can build and publish their first Power BI report in just 20 minutes.
Takeaways
- 😀 Power BI may seem overwhelming at first, but following along with tutorials can make it easier to get started.
- 😀 Download the necessary files from the description to follow along and create your first Power BI dashboard in just 20 minutes.
- 😀 To install Power BI Desktop, visit the Microsoft Store or the Power BI website, then log in with your work account to start creating reports.
- 😀 To import data, Power BI offers options from various sources, including Excel, CSV, and even the web or SharePoint. You can also transform the data as needed during the import process.
- 😀 The Power Query Editor helps clean and transform data by recognizing data types, promoting headers, and allowing easy column merging or splitting.
- 😀 Creating relationships between data tables in Power BI is crucial for accurate reporting. Relationships can be set automatically or manually, ensuring correct data connections.
- 😀 Power BI allows easy creation of visualizations like column charts, bar charts, and KPI cards. You can change the chart type or format without advanced skills.
- 😀 Slicers in Power BI allow users to filter data easily by year or category, updating all visuals on the report simultaneously for better analysis.
- 😀 Power BI has built-in time intelligence options for year-over-year comparisons, year-to-date calculations, and percentage changes without needing to write complex DAX formulas.
- 😀 After creating a report, it can be published to Power BI service for web access, where others can interact with the report, apply filters, and share insights.
- 😀 Reports can be integrated into Microsoft Teams, allowing users to interact with Power BI reports within the Teams interface for easier collaboration and analysis.
Q & A
What is the first step to getting started with Power BI?
-The first step is to install Power BI Desktop, which can be done via the Microsoft Store or directly from the Power BI website. After installation, open the application and log in with your work account.
How do you import data into Power BI?
-You can import data by clicking on the 'Get Data' option in Power BI. From there, you can choose from various data sources such as Excel, CSV, SQL, and more. In the tutorial, the user imports data from an Excel file and a CSV file.
What is the Power Query Editor, and why is it important?
-The Power Query Editor is a tool within Power BI that allows you to transform and clean your data before loading it into the model. It's crucial for ensuring that your data is in the right format (e.g., numbers, dates) and for performing operations like merging columns or removing unwanted data.
How does Power BI automatically detect data relationships?
-Power BI uses a feature called 'Auto Detect New Relationships,' which automatically detects and sets up relationships between tables based on matching columns, such as customer IDs in this tutorial. This feature can be enabled or disabled in the options menu.
What are Quick Measures in Power BI?
-Quick Measures are pre-built calculations in Power BI that allow users to perform complex data analysis without having to write custom DAX (Data Analysis Expressions) formulas. Examples include calculating year-over-year changes or year-to-date totals.
What should you do if Power BI does not automatically create a date hierarchy for a date column?
-If Power BI doesn't create a date hierarchy, you can manually add one by enabling the 'Auto Date/Time for new files' feature in the data load settings. Alternatively, you can create a custom date table for more advanced date analysis.
What is the purpose of using slicers in Power BI reports?
-Slicers are used to filter data in reports. They allow users to interactively select values (e.g., years, categories) to filter all visuals on the report page, making it easier to explore data dynamically.
What is the significance of relationships in Power BI models?
-Relationships in Power BI link different tables, allowing you to perform complex data analysis by connecting related data points across tables. For instance, the customer master data is connected to the invoice data through customer ID, enabling integrated analysis.
How do you publish a Power BI report to the web?
-To publish a report to the web, click on the 'Publish' button in Power BI Desktop, select the destination workspace (e.g., reports), and after the upload, you can access the report through Power BI's online service. From there, you can share it with others or embed it in other platforms like Microsoft Teams.
What are some of the options for visualizing data in Power BI?
-Power BI offers various types of visualizations, including column charts, bar charts, line charts, maps, and tables. You can customize the visual types according to your data and adjust formatting options like axis titles, colors, and labels.
Outlines

This section is available to paid users only. Please upgrade to access this part.
Upgrade NowMindmap

This section is available to paid users only. Please upgrade to access this part.
Upgrade NowKeywords

This section is available to paid users only. Please upgrade to access this part.
Upgrade NowHighlights

This section is available to paid users only. Please upgrade to access this part.
Upgrade NowTranscripts

This section is available to paid users only. Please upgrade to access this part.
Upgrade NowBrowse More Related Video

Power BI Desktop for Beginners | Step-by-Step Guide
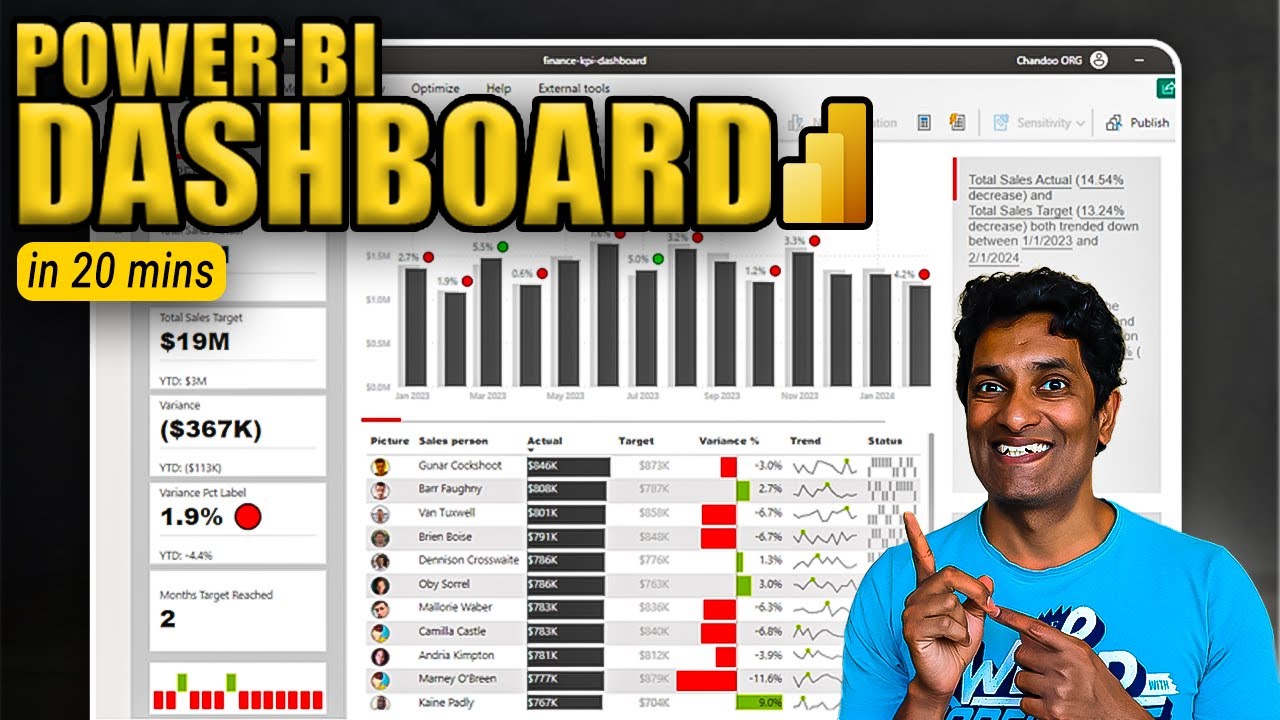
Make an Incredible Finance KPI Dashboard with Power BI in 20 minutes
How to Create Multiple Lines in Power BI Line Chart with Dimension or Measure
Automate you Power BI reports deployment using Azure DevOps
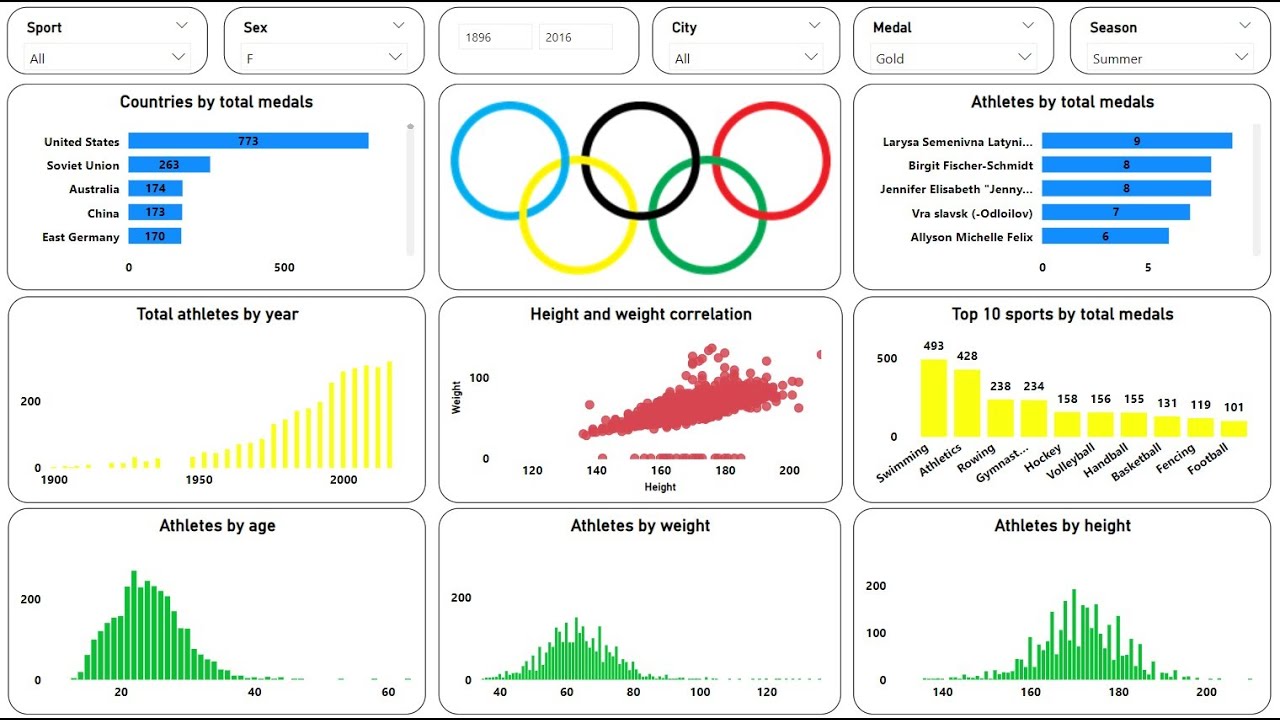
Create an Amazing Power BI Dashboard in 17 minutes | 120 years of olympics Dataset

Curso Básico Power BI 2025 - Aula 1 - Introdução ao Power BI
5.0 / 5 (0 votes)