NVDA Stock - Has NVIDIA Topped Out Here?
Summary
TLDRIn this Nvidia daily update, the presenter analyzes the stock’s recent performance and provides insights into its potential movement. Nvidia is currently in a consolidation phase, facing some buyer exhaustion, but the overall trend remains bullish as long as it stays above key levels like the 170 mark. A possible retracement to the low 150s is discussed, particularly if momentum fades. Technical indicators like the SMI and MACD are also examined, with a warning of potential bearishness if certain support levels are broken. The presenter emphasizes the need for continued monitoring and highlights options flow signaling bearish bets.
Takeaways
- 😀 Nvidia stock is currently in a consolidation phase, with a lack of significant movement for about a week.
- 😀 The 170 level is crucial for Nvidia's short-term support, and a loss of this level could signal potential bearishness.
- 😀 The stock has shown signs of buyer exhaustion, as seen in the fading momentum after multiple bullish flags.
- 😀 If Nvidia closes below 170 on an hourly or daily basis, it could indicate a potential retracement to lower levels.
- 😀 While the stock is not yet bearish, there is rising concern about a potential bearish shift if key support levels are lost.
- 😀 The SMI and MACD indicators suggest that Nvidia's stock could be reaching its peak, with overbought conditions and a possible retracement in the future.
- 😀 A potential retracement could lead Nvidia's stock to fall to the low 150s or high 140s, where previous resistance may turn into support.
- 😀 If Nvidia loses the 140 level, it could be a strong bearish signal, indicating a large false breakout and a significant drop in the stock.
- 😀 The stock's overall trend remains bullish, with the MACD and EMAs still in favorable conditions for upward movement.
- 😀 There is some bearish activity in the options flow, with large bets on Nvidia falling to lower levels, signaling possible concern from investors.
Q & A
What is the general trend in Nvidia's stock performance according to the video?
-Nvidia's stock is currently in a consolidation phase, with brief upward moves followed by periods of stagnation. The stock has had a phenomenal run but is showing signs of buyer exhaustion.
What does the analyst think about Nvidia's stock momentum?
-The analyst believes the stock feels heavy and that the momentum to the upside is fading, showing signs of buyer exhaustion. However, this does not indicate the stock is bearish yet.
What is the key level to watch for in Nvidia's stock in the short term?
-The key level to watch is $170. If the stock drops below $170 and closes below that level, it could signal a potential decline, especially if the 9-day exponential moving average (EMA) is lost.
Why is the $170 level significant for Nvidia's stock?
-The $170 level has acted as a resistance in the past and is now serving as support. If the stock loses this level, it could indicate a shift in momentum and potential further decline.
What could happen if Nvidia's stock closes below the $170 level?
-If Nvidia closes below $170, it could signal a retracement and a potential drop to lower levels, such as the low 150s, as the stock might move back within its established channel.
What does the analyst mention about the weekly chart and Nvidia's previous movements?
-The analyst notes that Nvidia tends to show signs of topping out when it has parabolic moves up, with overbought conditions on the SMI and a lower high on the MACD histogram, both of which suggest potential retracements.
What is the current condition of the SMI and MACD on Nvidia's weekly chart?
-The SMI is in overbought territory and about to flip bearish, while the MACD does not yet show a lower high. A bearish crossover on the SMI and a lower low on the MACD could signal a retracement.
What could trigger a larger retracement in Nvidia's stock according to the analysis?
-A larger retracement could occur if the stock closes lower into the 160s and the SMI turns bearish with a lower low on the MACD. This would suggest that the stock is cooling off after a parabolic run-up.
What is the significance of the low 150s and high 140s levels for Nvidia?
-The low 150s and high 140s represent a significant area of resistance for Nvidia, which could now turn into support in case of a retracement. These levels were important in the past, and the analyst expects them to act as a support zone moving forward.
What would be a highly bearish signal for Nvidia's stock according to the analyst?
-A loss of the $140 level, with weekly closes well below that, would be a highly bearish signal, suggesting a false breakout and potential for a steep decline.
Outlines

This section is available to paid users only. Please upgrade to access this part.
Upgrade NowMindmap

This section is available to paid users only. Please upgrade to access this part.
Upgrade NowKeywords

This section is available to paid users only. Please upgrade to access this part.
Upgrade NowHighlights

This section is available to paid users only. Please upgrade to access this part.
Upgrade NowTranscripts

This section is available to paid users only. Please upgrade to access this part.
Upgrade Now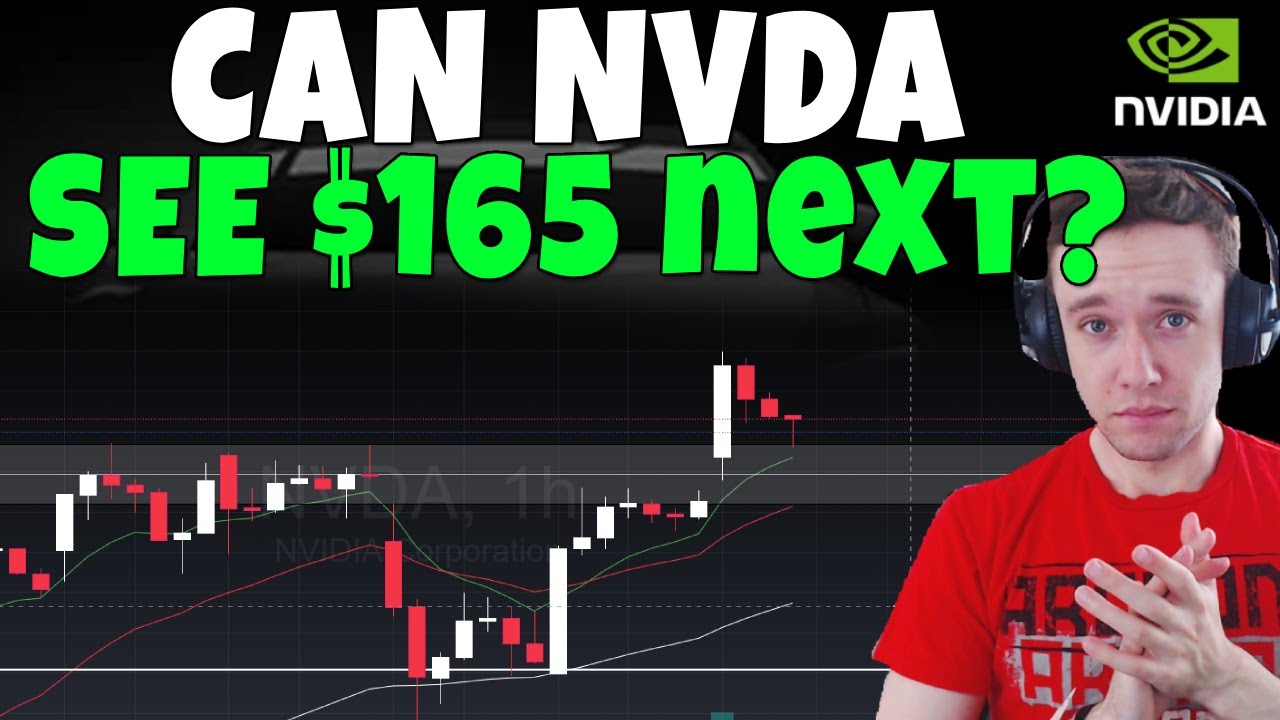


5.0 / 5 (0 votes)