NVDA Stock - Can NVIDIA Still See $165?
Summary
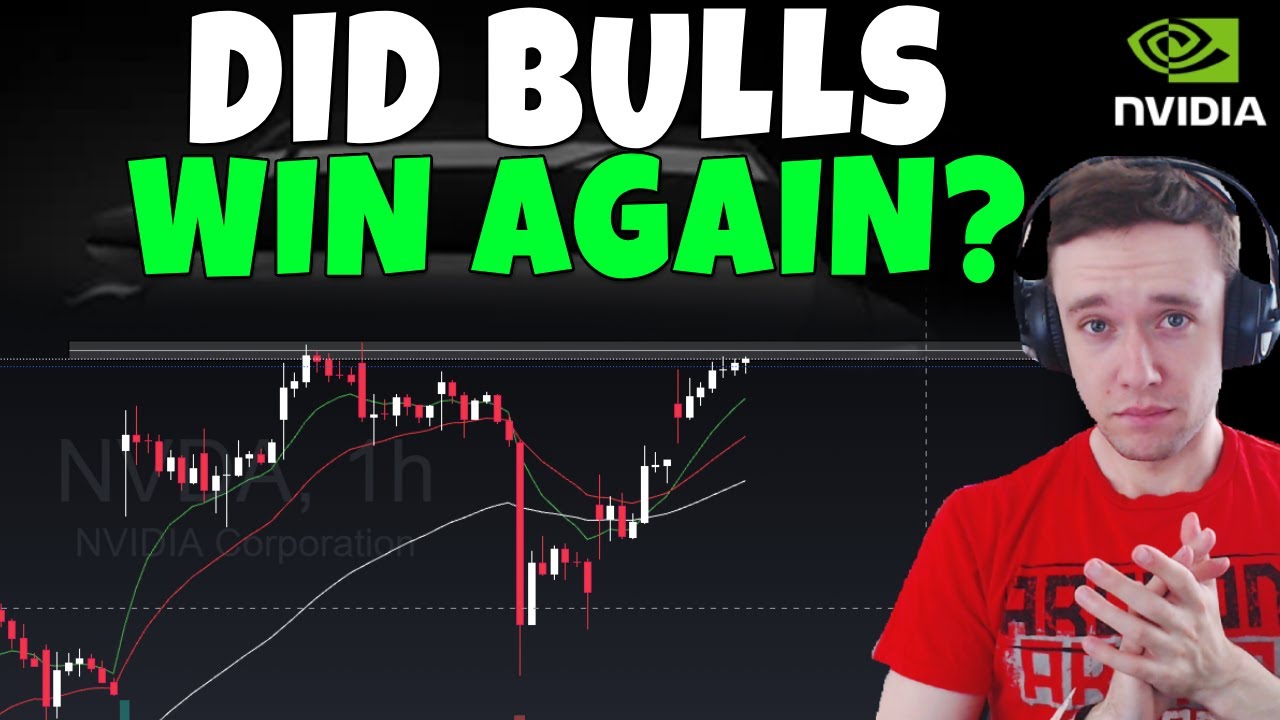
TLDRIn this Nvidia daily update video, the speaker analyzes Nvidia's stock performance, discussing its bullish momentum and key support levels. Despite a slight dip, the stock remains strong, with support at $157-$158. The speaker highlights the importance of key pivot points, such as $142, for potential bearish signals. While Nvidia is showing strength with positive technical indicators, short-term corrections and key resistance levels like $165 are also discussed. Options activity signals bullish sentiment, and the speaker shares their expectations for the stock’s near-term movements, maintaining a mostly positive outlook unless major support levels are breached.
Takeaways
- 😀 The video discusses the latest Nvidia stock update, including its performance, outlook, and potential future movements.
- 😀 The stock is currently in a bullish trend, riding a large rising channel with bullish indicators like MACD and Stochastic.
- 😀 A short-term level of support for Nvidia is identified around $157-$158, which has been both resistance and support in the past.
- 😀 Losing the $157 support level would indicate potential short-term weakness, and could lead to a retest of the 9 exponential moving average (around $155).
- 😀 The stock has never convincingly lost the 9 exponential moving average during its uptrend, maintaining bullish momentum.
- 😀 Major downside support levels to watch are $153 (previous all-time high), $149-$148, and $144-$145, with each level acting as a potential support zone.
- 😀 Losing the key $142 level would signal a much deeper bearish trend, potentially breaking the upward channel and leading to a larger correction.
- 😀 A potential scenario for a deeper correction would involve a fall below $142, leading to a drop to around $130 or even $120.
- 😀 The video also discusses the market’s potential resistance around the $142-$150 range, where Nvidia faced significant rejection previously before breaking out.
- 😀 Despite some overextension on the weekly chart, the stock is expected to continue its upward trend as long as it holds above key support levels, especially $157.
- 😀 The video ends with mention of a recent large bullish options trade, where $4.2 million worth of calls on Nvidia's 160 strike were bought, reinforcing a bullish outlook.
Q & A
What is the overall sentiment of the Nvidia stock as discussed in the video?
-The overall sentiment for Nvidia stock is bullish. The stock remains in an uptrend within a rising channel, with indicators like MACD, Stochastic, and exponential moving averages all signaling bullish momentum.
What is the key level to watch for potential short-term weakness in Nvidia stock?
-The key level to watch for short-term weakness is the 157-158 range. If the stock starts closing below 157 on hourly candles, it could signal a short-term drop, possibly leading to a retest of the 9 exponential moving average around 155.
How does the stock behave in relation to the 9 exponential moving average?
-The stock has consistently held above the 9 exponential moving average, riding it upward throughout the current uptrend. It has never convincingly closed below this level, which suggests strong bullish momentum.
What would be a major red flag indicating a potential bearish trend for Nvidia?
-A major red flag would be if Nvidia loses the 142 level, which is a key pivot point. If the stock falls below this level, it could signify a shift towards a more bearish trend, potentially breaking out of the current bullish channel.
What are the key support levels identified in the video for Nvidia stock?
-The key support levels for Nvidia are 157, 155 (9 exponential moving average), 153 (previous all-time high), 149-148 (prior all-time highs), and 144-145 (a potential gap fill). These levels serve as important areas to watch for potential downside movement.
What does the video say about the possibility of a deeper correction for Nvidia stock?
-The video mentions that a deeper correction could occur if the stock loses the 142 level, which could lead to a fall out of the bullish channel and bring the stock price down to 130 or even 120.
What is the significance of the $160 strike price options mentioned in the video?
-The mention of a $160 strike price options trade is seen as bullish, as a large amount of call options (4.2 million) were purchased, indicating market participants are betting on the stock moving higher towards the mid-160s.
How does the current price action relate to Nvidia's previous resistance levels?
-The current price action shows that Nvidia has broken through previous resistance levels around 142-150. If the stock pulls back to these levels, it would likely be viewed as a bullish retest, with the potential to move higher once again.
What is the significance of Nvidia's movement in relation to the overall market?
-Despite a small decline on the day, Nvidia's stock held its own relative to the market, showcasing resilience. This relative strength indicates that the stock is outperforming broader market trends.
What is the video creator's current position on Nvidia stock?
-The video creator is currently not holding any position in Nvidia stock. They are observing the stock's movement but are more actively involved in AMD at the moment.
Outlines

This section is available to paid users only. Please upgrade to access this part.
Upgrade NowMindmap

This section is available to paid users only. Please upgrade to access this part.
Upgrade NowKeywords

This section is available to paid users only. Please upgrade to access this part.
Upgrade NowHighlights

This section is available to paid users only. Please upgrade to access this part.
Upgrade NowTranscripts

This section is available to paid users only. Please upgrade to access this part.
Upgrade Now


5.0 / 5 (0 votes)