25 Modeling Zona Genangan akibat Tsunami atau ROB
Summary
TLDRThis video explores the process of modeling tsunami-induced inundation zones using spatial analysis tools in ArcGIS. It covers the key factors involved in tsunami modeling, including tsunami wave height, surface roughness, and slope. The speaker demonstrates how to use satellite imagery and land cover data to create accurate models, explaining the steps of input data preparation, equation application, and spatial analysis. The video also highlights the technical tools and formulas used to estimate the tsunami's impact on coastal areas, with a focus on creating detailed visualizations for decision-making and disaster management.
Takeaways
- 😀 Inundation modeling for tsunamis uses spatial analysis tools in ArcGIS to predict the tsunami wave's impact along coastlines.
- 😀 Key parameters in tsunami modeling include tsunami wave height (h₀), surface roughness coefficient (n), and surface slope.
- 😀 The roughness coefficient (n) is derived from land cover types, such as vegetation, buildings, and water bodies.
- 😀 The tsunami inundation equation accounts for wave height, roughness coefficient, and slope, calculating how the tsunami height decreases over distance.
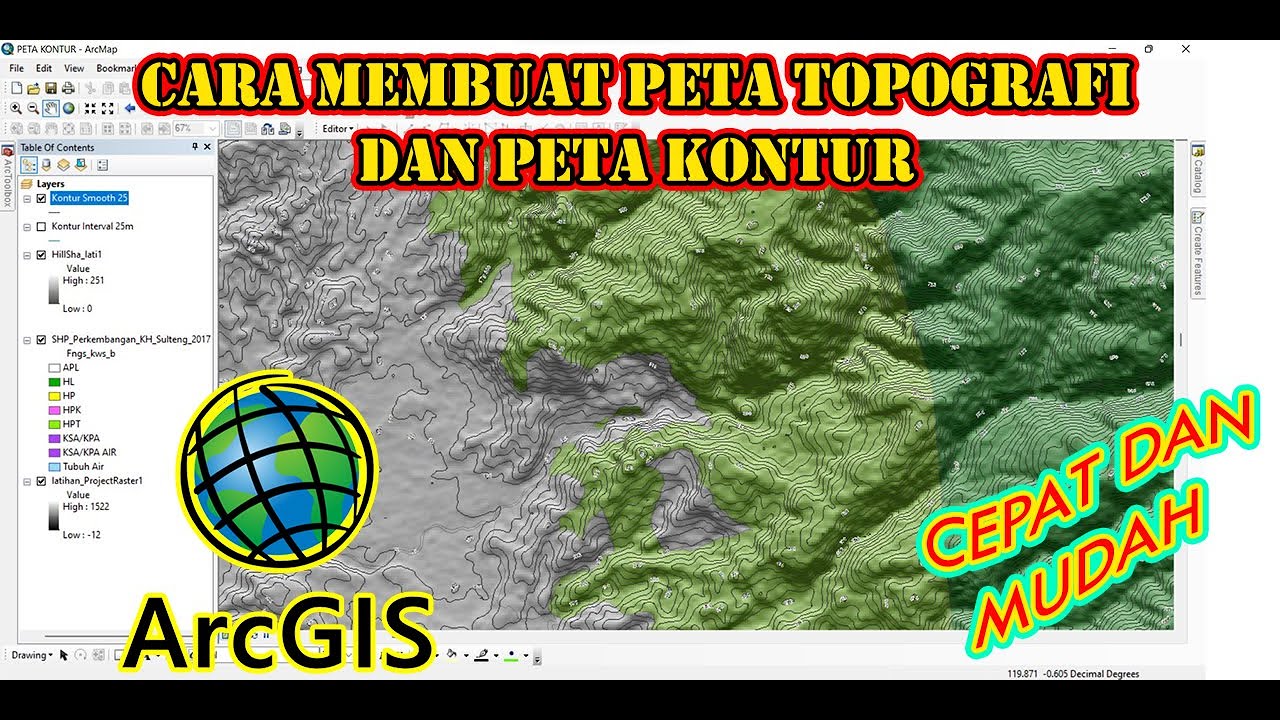
- 😀 ArcGIS tools like slope analysis and land cover conversion help generate the necessary input data for the model.
- 😀 Inundation modeling requires transforming land use data into roughness coefficients for accurate predictions.
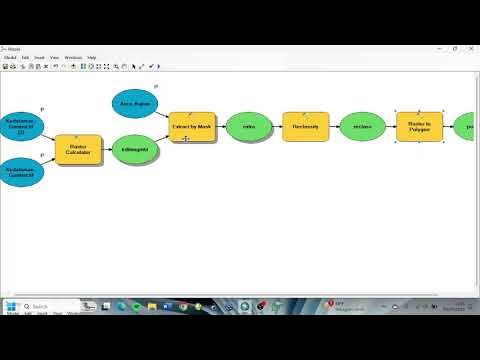
- 😀 The model is built in ArcGIS using the Model Builder, which integrates slope and roughness data to calculate inundation zones.
- 😀 The input data includes land use, slope, and coastline information to estimate tsunami inundation at various points.
- 😀 The model uses Digital Elevation Models (DEMs) to calculate the slope, essential for determining how tsunami waves will propagate inland.
- 😀 The output from the model is a raster map showing the extent of tsunami inundation, which helps in understanding affected areas for disaster management.
Q & A
What is the primary goal of the tsunami modeling described in the script?
-The primary goal is to model the inundation zones caused by tsunamis, particularly focusing on the impact of tsunami waves on the coastline and how they spread inland.
What spatial analysis tool is used for tsunami modeling in the described process?
-The spatial analysis tool used for tsunami modeling in the process is ArcGIS, which helps in analyzing the surface roughness, slope, and tsunami wave height.
What are the main input parameters used in the tsunami modeling process?
-The main input parameters are the height of the tsunami wave at the coastline, surface roughness coefficient derived from land cover, and the magnitude of the surface slope.
How is the surface roughness coefficient (n) derived for the model?
-The surface roughness coefficient is derived from land cover data, which is obtained using satellite imagery. Different land types such as buildings, vegetation, and water bodies have specific roughness values.
What equation is used in the tsunami inundation modeling process?
-The equation used involves the loss of tsunami height per meter of distance, considering surface roughness, slope, and the initial tsunami wave height at the coastline.
How is the slope of the land incorporated into the tsunami inundation model?
-The slope is calculated from Digital Elevation Model (DEM) data, and it is incorporated into the model to determine how the tsunami wave height changes as it moves inland.
What role does the QOS (Quality of Service) distance function play in the tsunami modeling?
-The QOS distance function estimates the loss of tsunami inundation height from the coastline to inland areas, helping to simulate the wave propagation and its reduction in height over distance.
What is the significance of converting land cover data to raster format for the model?
-Converting land cover data into raster format allows the model to perform spatial analysis on the roughness coefficients and integrate them into the tsunami inundation model.
What GIS tool is used to convert the land use vector data into a raster format?
-The 'Polygon to Raster' tool in ArcGIS is used to convert land use vector data into raster format, enabling the application of the roughness coefficient data in the tsunami model.
How is the output of the tsunami model displayed and interpreted?
-The output of the tsunami model is displayed as a raster map showing the inundation zones, with different colors indicating varying tsunami wave heights, and adjustments are made to the results based on the maximum slope and coastline conditions.
Outlines

This section is available to paid users only. Please upgrade to access this part.
Upgrade NowMindmap

This section is available to paid users only. Please upgrade to access this part.
Upgrade NowKeywords

This section is available to paid users only. Please upgrade to access this part.
Upgrade NowHighlights

This section is available to paid users only. Please upgrade to access this part.
Upgrade NowTranscripts

This section is available to paid users only. Please upgrade to access this part.
Upgrade Now


5.0 / 5 (0 votes)