Choosing which statistical test to use: Practice examples
Summary
TLDRThis video guides viewers through choosing the appropriate statistical test for various scenarios. Dr. NIC from Creative Maths explains concepts such as comparing means, proportions, and predicting outcomes using regression analysis. The video covers a variety of examples, including car fuel consumption, employee retention, faulty electronics, sorting algorithms, and recruitment assessments. It also introduces chi-squared tests, paired samples, and independent samples tests, helping learners understand how to apply statistical methods in real-world contexts. Each example is accompanied by a detailed explanation of the relevant statistical test, making the process of choosing the right test more approachable.
Takeaways
- 😀 The video helps viewers choose the appropriate statistical test for different scenarios.
- 😀 It's important to understand the type of data (nominal, interval/ratio) before selecting a test.
- 😀 A **t-test** is used when comparing the mean of a sample to a known value (e.g., petrol consumption example).
- 😀 **Independent samples t-test** compares means between two independent groups (e.g., school leavers vs. others).
- 😀 **Paired samples t-test** is used when comparing two sets of related data (e.g., comparing pre-test and post-test scores).
- 😀 **Chi-squared tests** are used to test relationships between categorical data (e.g., comparing group types and dessert choices).
- 😀 **Regression analysis** helps predict an outcome based on another variable (e.g., predicting employment length based on recruitment score).
- 😀 **Z-test for proportions** is used when testing the proportion of an outcome against a standard (e.g., faulty components).
- 😀 It's essential to identify whether you are dealing with one sample or multiple samples when selecting a test.
- 😀 Understanding the research purpose (e.g., testing for differences, relationships, or predictions) is crucial to choosing the correct statistical test.
Q & A
What is the first step when choosing a statistical test?
-The first step is to understand the type of data you are working with and the purpose of the analysis. This will help determine the appropriate statistical test.
In Example 1, why is a one-sample t-test used for petrol consumption?
-A one-sample t-test is used because the goal is to compare the sample mean of petrol consumption to a claimed population mean (5 liters per 100 kilometers).
What type of data is being used in Example 2, and why is an independent samples t-test appropriate?
-Example 2 involves interval/ratio data (the length of time employees stay), and an independent samples t-test is appropriate because we are comparing the means of two independent groups (school leavers vs. others).
Why is a one-sample proportion test used in Example 3?
-A one-sample proportion test is used because the aim is to compare the sample proportion of faulty components to a specified standard (1%).
What statistical test is suggested for Example 4 (Recruitment Assessment), and why?
-Regression analysis is recommended in Example 4 because we want to predict how long an employee will stay based on their recruitment assessment score, which involves examining the relationship between two continuous variables.
What is the difference between a paired samples t-test and an independent samples t-test as explained in Example 5 and Example 9?
-A paired samples t-test compares two related groups, such as before and after measurements on the same subjects (Example 5), while an independent samples t-test compares two unrelated groups (such as two different groups of learners in Example 9).
In Example 6, why is an independent samples proportion test used for comparing two testers?
-An independent samples proportion test is used because we are comparing the proportions of passed cars between two independent testers, and the data is categorical (pass/fail).
What does the chi-squared test for independence do in Example 7 (Group Dessert Habits)?
-The chi-squared test for independence is used to determine if there is a significant relationship between two categorical variables, in this case, group type (women, mixed, family) and whether or not they stayed for dessert.
Why is a paired samples t-test used in Example 8 (Multi-Vector Effectiveness)?
-A paired samples t-test is used because the same group of learners is tested before and after playing the multi-vector game, and we are comparing the mean difference in scores for each learner.
In Example 9, how does the presence of a control group affect the statistical test choice?
-In Example 9, the presence of a control group allows for the comparison of the differences in scores between two independent groups (one group playing the game, the other doing worksheets), which is why an independent samples t-test is used.
Outlines

This section is available to paid users only. Please upgrade to access this part.
Upgrade NowMindmap

This section is available to paid users only. Please upgrade to access this part.
Upgrade NowKeywords

This section is available to paid users only. Please upgrade to access this part.
Upgrade NowHighlights

This section is available to paid users only. Please upgrade to access this part.
Upgrade NowTranscripts

This section is available to paid users only. Please upgrade to access this part.
Upgrade NowBrowse More Related Video

T-test, ANOVA and Chi Squared test made easy.

How to choose an appropriate statistical test

31. OCR A Level (H046) SLR6 - 2.2 Test data & user feedback
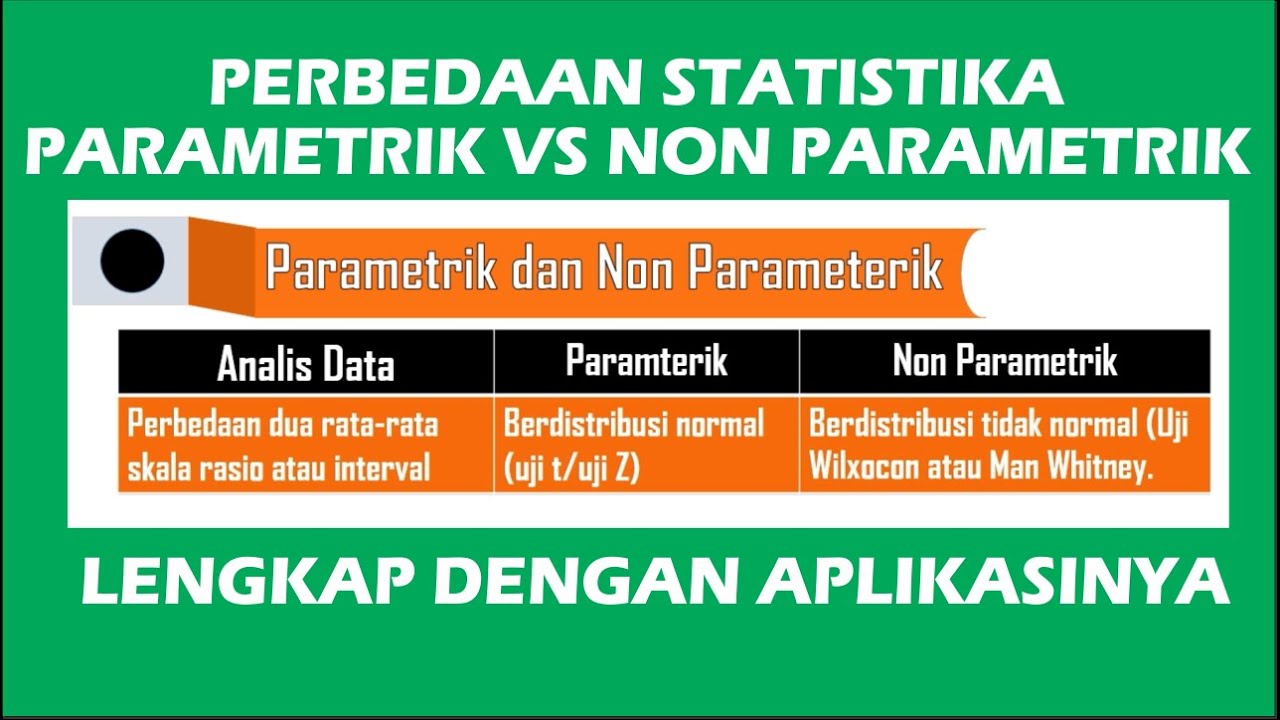
Perbedaan Statistika Parametrik dan Non Parametrik

How To Know Which Statistical Test To Use For Hypothesis Testing

Penelitian Kuantitatif (Menentukan metode analisis data dari judul)
5.0 / 5 (0 votes)