Perbedaan Statistika Parametrik dan Non Parametrik

Dunia Statistika
4 Jan 202114:25

Summary

TLDRThis video script offers an insightful overview of parametric and nonparametric statistics, explaining the conditions under which each type of statistical analysis is appropriate. It covers the importance of data distribution in choosing the right test, with parametric tests used for normally distributed ratio or interval scale data and nonparametric tests for non-normal distributions or ordinal and nominal scales. The speaker also introduces various statistical tests, including t-tests, Wilcoxon, Mann-Whitney, ANOVA, Kruskal-Wallis, and logistic regression, tailored to different data types and research questions. Despite technical difficulties with the camera overheating, the presenter remains dedicated to educating viewers on the versatility of statistical methods, even when data does not meet normal distribution assumptions.

Takeaways

  • πŸ“š The video discusses the topic of statistics, specifically parametric and nonparametric statistics.
  • πŸ” Statistics is divided into descriptive and inferential statistics; descriptive for presenting data, and inferential for drawing conclusions through data analysis.
  • πŸ“ˆ Descriptive statistics make data more understandable through tables and graphs, while inferential statistics use analysis methods.
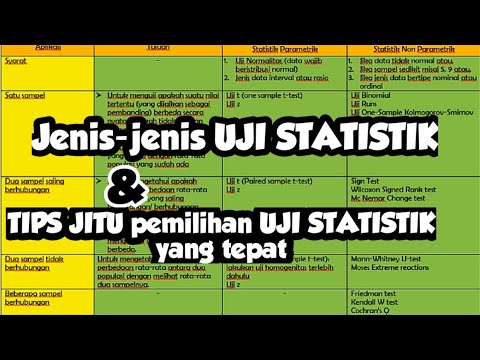
  • πŸ“Š Inferential statistical analysis is further divided into parametric and nonparametric methods based on the data's distribution and scale.
  • πŸ“‰ Parametric statistics are used for ratio and interval scales, requiring normal distribution, while nonparametric statistics are for nominal and ordinal scales without normal distribution.
  • 🌑 Examples of interval scale data include body temperature and height, which have absolute zero values and no negative values.
  • 🏷️ Nominal scale data are categorical without order or rank, such as religion or gender.
  • πŸ”’ Ordinal scale data are categorized but have a rank or order, like Likert scale responses in surveys.
  • 🧐 When data does not follow a normal distribution, nonparametric tests like the Wilcoxon or Mann-Whitney tests are used instead of parametric tests.
  • πŸ“ The video references a book titled 'Dasar Metodologi Penelitian Kuantitatif, Kualitatif, dan Statistika' by Sarmanu published in 2017 as the source material.
  • 🌟 The speaker encourages viewers to share references or books for further discussion on nonparametric tests that were not explained in the video.

Q & A

  • What is the main topic of the video script?

    -The main topic of the video script is statistics, specifically focusing on parametric and nonparametric statistics.

  • What are the two types of statistical analysis mentioned in the script?

    -The two types of statistical analysis mentioned are descriptive statistics and inferential statistics.

  • What is the difference between parametric and nonparametric statistics?

    -Parametric statistics are used when the data follows a normal distribution and the scale is ratio or interval. Nonparametric statistics are used when the data does not follow a normal distribution and the scale is nominal or ordinal.

  • What are the conditions for using parametric tests?

    -Parametric tests are used when the data is on a ratio or interval scale and is normally distributed.

  • What are the conditions for using nonparametric tests?

    -Nonparametric tests are used when the data is on a nominal or ordinal scale or when the data does not follow a normal distribution.

  • What are the types of data scales mentioned in the script?

    -The types of data scales mentioned are ratio, interval, nominal, and ordinal.

  • What is an example of a ratio scale measurement?

    -An example of a ratio scale measurement is height or weight, where zero represents an absolute absence of the attribute.

  • What is an example of an interval scale measurement?

    -An example of an interval scale measurement is temperature, which can have negative values but does not have a true zero point.

  • What is the reference book mentioned in the script?

    -The reference book mentioned is 'Dasar Metodologi Penelitian Kuantitatif, Kualitatif dan Statistika' by Sarmanu, published in 2017.

  • What are some of the statistical tests mentioned in the script for different data scales and distributions?

    -Some of the statistical tests mentioned include t-tests, z-tests, Wilcoxon test, Mann-Whitney test, ANOVA, Kruskal-Wallis test, and logistic regression.

  • What is the purpose of using descriptive statistics?

    -The purpose of using descriptive statistics is to present data in a way that is easier to understand, such as through tables and graphs.

  • What is the purpose of using inferential statistics?

    -The purpose of using inferential statistics is to draw conclusions about a population based on sample data using statistical methods of analysis.

  • What is the script's advice for dealing with data that is not normally distributed?

    -The script advises using nonparametric tests when dealing with data that is not normally distributed.

  • What is the script's suggestion for further learning about nonparametric tests?

    -The script suggests discussing and sharing references or books on nonparametric tests to enhance understanding and become a collective learning source.

Outlines

00:00

πŸ“š Introduction to Parametric and Nonparametric Statistics

The speaker begins by greeting the audience and introducing the topic of statistics, specifically parametric and nonparametric statistics. They mention that the material is based on a 2017 book titled 'Quantitative, Qualitative, and Statistical Research Methodology.' The speaker explains the difference between descriptive and inferential statistics, highlighting that the former presents data in an understandable format through tables and graphs, while the latter involves data analysis methods. The choice between parametric and nonparametric analysis is determined by the scale of the data and its distribution. Parametric tests are used for ratio and interval scales, assuming normal distribution, while nonparametric tests are applied for nominal and ordinal scales without normal distribution.

05:00

πŸ“ Understanding Data Scales and Statistical Tests

This paragraph delves into the different scales of data: ratio, interval, nominal, and ordinal. The ratio scale is characterized by an absolute zero, such as weight or height, while the interval scale does not have an absolute zero, exemplified by temperature and exam scores. Nominal scale data are categorical without order or rank, like religion or gender, whereas ordinal scale data have ranks or order, such as survey responses on a Likert scale. The speaker then discusses the appropriate statistical tests for each scale and distribution type, including parametric tests like t-tests or z-tests for normally distributed data and nonparametric tests like Wilcoxon or Mann-Whitney tests for non-normally distributed data.

10:02

πŸ” Advanced Statistical Analysis Techniques

The speaker discusses advanced statistical analysis techniques for different types of data and research questions. For ordinal data, they mention the use of nonparametric tests like Wilcoxon or Mann-Whitney tests. For comparing more than two treatments, they introduce ANOVA for normally distributed data and Kruskal-Wallis or Friedman tests for non-normally distributed data. The speaker also covers multivariate analysis for more than one dependent variable, mentioning MANOVA and Hotelling's T-squared test. They discuss regression analysis for the effect of variables on a dependent variable, logistic regression for nominal data, and various correlation tests for different data scales and distributions. The paragraph concludes with a mention of univariate and multivariate tests, and the speaker invites the audience to share references or books for further discussion on nonparametric tests not covered in the book.

Mindmap

Keywords

πŸ’‘Statistics

Statistics is the science of collecting, organizing, analyzing, and interpreting data. In the video, the speaker discusses various statistical methods, emphasizing its importance in data analysis and research methodology. The term is central to the video's theme of understanding and applying statistical tests.

πŸ’‘Parametric Statistics

Parametric statistics refers to a set of statistical methods that assume the data follows a particular probability distribution, often the normal distribution. The video mentions when to use parametric tests, such as when data is on a ratio or interval scale and is normally distributed.

πŸ’‘Nonparametric Statistics

Nonparametric statistics are statistical methods that do not rely on the assumption of a specific distribution of the data. The video script discusses the use of nonparametric tests when data does not follow a normal distribution, emphasizing their applicability in various scenarios.

πŸ’‘Descriptive Statistics

Descriptive statistics are used to summarize and organize data in a meaningful way, such as through tables and graphs. The video explains that this type of statistics helps in making data more comprehensible to others, showcasing the data presentation aspect of statistics.

πŸ’‘Inferential Statistics

Inferential statistics involve making inferences about a population based on a sample. The video contrasts this with descriptive statistics, highlighting that inferential statistics use analytical methods to go beyond the data at hand to make broader conclusions.

πŸ’‘Data Scales

Data scales refer to the types of scales on which data can be measured, such as ratio, interval, nominal, and ordinal. The script explains the characteristics of each scale and their relevance to choosing the appropriate statistical tests.

πŸ’‘Normal Distribution

A normal distribution is a continuous probability distribution in which data points are symmetrically distributed around the mean. The video script discusses the importance of data being normally distributed for the use of parametric tests.

πŸ’‘Hypothesis Testing

Hypothesis testing is a process of making decisions about a population parameter based on a sample. The video mentions various tests like t-tests and z-tests for parametric data and Wilcoxon or Mann-Whitney tests for nonparametric data, illustrating the application of hypothesis testing in statistics.

πŸ’‘ANOVA (Analysis of Variance)

ANOVA is a statistical method used to compare the means of more than two groups to see if they are significantly different. The video script refers to ANOVA as a parametric test used when data is normally distributed and the researcher wants to compare multiple treatments.

πŸ’‘Kruskal-Wallis Test

The Kruskal-Wallis test is a nonparametric method for comparing three or more independent samples to determine if they originate from the same distribution. The video mentions this test as an alternative to ANOVA when data does not follow a normal distribution.

πŸ’‘Regression Analysis

Regression analysis is a set of statistical processes that estimates the relationships among variables. The video script discusses using regression analysis when the data is on a ratio or interval scale to examine the impact of variables on one another.

πŸ’‘Logistic Regression

Logistic regression is a statistical method for analyzing a dataset in which the response variable is categorical. The video mentions using logistic regression when the data is nominal, indicating its use for binary outcome predictions.

πŸ’‘Correlation

Correlation measures the extent to which two variables are linearly related. The video script differentiates between Pearson correlation for normally distributed data and Spearman's rank correlation for non-normally distributed ordinal data, showing the importance of selecting the right correlation method based on data characteristics.

πŸ’‘Multivariate Analysis

Multivariate analysis deals with datasets that involve multiple interdependent variables. The video briefly touches on MANOVA (Multivariate Analysis of Variance) and Hotelling's T-squared test as examples of multivariate statistical methods.

Highlights

Introduction to the topic of statistics, specifically parametric and nonparametric statistics.

Explanation of when to use parametric tests if the data follows a normal distribution and nonparametric tests otherwise.

Differentiation between parametric and nonparametric statistics based on the scale of data: ratio and interval for parametric, nominal and ordinal for nonparametric.

Description of data scales: ratio, interval, nominal, and ordinal, with examples for each.

Mention of the reference book 'Dasar Metodologi Penelitian Kuantitatif, Kualitatif dan Statistika' by Sarmanu (2017) as the source of the material.

Clarification on the use of t-tests or z-tests for parametric data analysis and Wilcoxon or Mann-Whitney tests for nonparametric data.

Discussion on the use of ANOVA for comparing more than two treatments with normally distributed data.

Introduction of Kruskal-Wallis or Friedman tests for non-normally distributed data when comparing more than two treatments.

Explanation of using chi-square tests for the difference between two means when data is nominal.

Mention of multivariate analysis for data with more than one variable, such as MANOVA or Hotelling's T-squared test.

Discussion on regression analysis for the impact of variables on a ratio or interval scale and its nonparametric alternatives.

Introduction of logistic regression for the impact of variables on nominal data.

Explanation of Pearson correlation for the relationship between variables on a ratio or interval scale with normal distribution.

Introduction of Spearman's rank correlation for relationships between ordinal variables.

Discussion on multiple correlation tests for relationships involving more than one independent variable.

Introduction of canonical correlation for relationships between variables with more than one dependent and independent variable.

Explanation of univariate and multivariate tests, including examples like t-tests for univariate and Hotelling's T-squared for multivariate.

Acknowledgment of the video's background noise due to a technical issue with the camera overheating.

Conclusion emphasizing the practicality of nonparametric tests when data does not follow a normal distribution.

Call to action for viewers to help identify and discuss unspecified nonparametric tests if they have references or books.

Closing remarks with a New Year's greeting and an invitation for viewers to join in further statistical discussions.

Transcripts

play00:00

Hai baik A1 mualaikum warahmatullahi

play00:12

wabarakatuh Selamat malam teman-teman

play00:16

semua dimanapun anda berada baik di awal

play00:19

tahun 2021 ini ya saya akan kembali

play00:27

share kepada temen-temen semua mengenai

play00:31

statistika ya Jadi pada kesempatan ini

play00:35

saya akan sharing mengenai statistika

play00:40

parametrik dan statistika nonparametrik

play00:42

Nah jadi di video ini nanti kita akan

play00:46

tahu jika ya Eh data yang akan kita

play00:52

analisis itu tidak bisa kita menggunakan

play00:56

uji parametrik maka uji no

play01:00

tak matic apa yang dapat kita gunakan

play01:03

Jadi mohon maaf saya agak sariawan jadi

play01:06

suara saya agak berbeda ya C ini

play01:10

materinya adalah statistika parametrik

play01:13

dan statistika non parametrik ya Nah ini

play01:18

adalah referensinya jika temen-temen

play01:20

ingin mengutip Ya materi yang ada yang

play01:25

saya sampaikan di video ini ini berasal

play01:28

dari buku sarmanu tahun 2017 judulnya

play01:33

dasar metodologi penelitian kuantitatif

play01:35

kualitatif dan statistika ya Nah sebelum

play01:42

kita masuk ke Apa itu statistika

play01:48

parametrik dan nonparametrik kita review

play01:52

lagi apa itu statistika ya jadi

play01:55

statistik sendiri adalah ya Ilmu yang

play01:58

membahas tentang bagaimana

play02:00

acara penyajian data pengolahan data dan

play02:05

juga bagaimana untuk menarik

play02:06

kesimpulannya nah dalam penarikan

play02:10

kesimpulannya ya that I've itu dibagi

play02:13

menjadi dua yaitu statistika deskriptif

play02:16

dan statistika inferensial ya Nah

play02:20

statistika deskriptif Yusni adalah

play02:23

statistika dimana kita menyajikan data

play02:26

itu agar lebih mudah dimengerti oleh

play02:29

orang lain Jadi data hasil penelitian

play02:31

kita itu bisa kita buat dalam bentuk

play02:33

tabel bisa kita buat dalam bentuk grafik

play02:36

sehingga orang dengan melihat tabel

play02:39

membaca tabel dan melihat grafik kita

play02:41

sudah paham Apa maksud dari data

play02:44

penelitian kita Nah kemudian ada

play02:48

statistika inferensial bedanya kalau

play02:51

statistika deskriptif kan kita menarik

play02:54

kesimpulan itu hanya berdasarkan grafik

play02:57

atau berdasarkan tabel saja tapi

play03:00

baru-baru statistika inferensial kita

play03:02

menggunakan metode analisis data nah

play03:04

metode analisis datanya dibagi menjadi

play03:06

dua yaitu metode analisis data

play03:09

menggunakan statistika parametrik dan

play03:12

mengedan statistika nonparametrik Kapan

play03:17

sih kita menggunakan statistika

play03:20

parametrik dan kapan kita menggunakan

play03:21

statistika non parametrik untuk

play03:25

statistika parametrik itu data

play03:28

penelitian kita itu dia skalanya adalah

play03:31

skala rasio dan skala interval Nah kalau

play03:35

nonparametrik itu adalah skalanya adalah

play03:38

skala nominal dan skala ordinal ya kalau

play03:43

parametrik itu syarat wajibnya data

play03:46

harus berbisnis ribu si normal kalau

play03:48

nonparametrik data tidak berdistribusi

play03:50

normal jadi saat data tidak berisi B

play03:54

berdistribusi normal kita menggunakan

play03:57

uji nonparametrik nah data

play04:00

shio atau interval yang tidak

play04:02

berdistribusi normal dia diuji dengan

play04:05

menggunakan uji non parametrik Nah tadi

play04:10

kan ada skala skala data nah ini saya

play04:13

akan mengulang jenis skala data dan

play04:15

contohnya pertama itu adalah skala rasio

play04:18

ya skala rasio itu adalah setelah data

play04:21

yang bersifat Absolut atau mempunyai

play04:24

angka nol mutlak contohnya itu adalah

play04:27

berat badan tinggi badan ya Nah Mengapa

play04:31

disebut disebut memiliki nilai nol

play04:33

mutlak karena tinggi badan itu paling

play04:35

tidak atau paling-paling kecil nol Ya

play04:40

tidak ada tinggi badan negatif berat

play04:42

badan juga sama berat badan itu paling

play04:45

kecil nol tidak ada berat badan negatif

play04:48

ya Nah sedangkan skala skala interval

play04:52

itu dia tidak bersifat Absolut artinya

play04:55

Dia memiliki nilai negatif contohya

play04:58

skala interval itu

play05:00

soalnya adalah suhu ya suhu itu ada

play05:02

nilai negatifnya negatif 5 negatif satu

play05:06

gitu ya tuh tetap ada artinya berarti

play05:10

dia adalah skala interval ya kemudian

play05:14

nilai ujian juga termasuk pada skala

play05:17

interval karena dia memiliki rentang

play05:20

0-100 begitu ya Oke kemudian skala

play05:24

nominal Apa itu skala nominal ya skala

play05:27

nominal dibalas Skala yang berbentuk

play05:30

kategori namun dia tidak memiliki

play05:32

tingkatan atau tidak memiliki strata

play05:35

contohnya itu jenis agama jenis kelamin

play05:38

hobi ya Misalnya kalian mengumpulkan

play05:41

data jenis agama keren bikin di situ

play05:44

satu agama Islam dua agama Kristen

play05:47

sehingga agama Hindu 4 agama budaya gitu

play05:50

ya jadi sini 1234 ini Dia tidak memiliki

play05:54

kasta ya Tidak ada yang lebih tinggi

play05:59

walaupun

play06:00

ada disitu 1234 ada angkanya tidak

play06:03

ber-ac A4 lebih tinggi dari angka 1 itu

play06:06

maksud dari skala nominal kalau skala

play06:10

ordinal ya Ia berbentuk kategori tapi

play06:13

dia memiliki strata nah ini biasanya

play06:17

data-data jika kalian mengumpulkan data

play06:21

dengan kuesioner atau angket kalian

play06:23

menggunakan skala likert contohnya

play06:25

kurang cukup baik sangat baik kurang

play06:29

kalian military angka satu cukup kalian

play06:31

beri angka2 baik kalian beli angka 3 dan

play06:34

sangat baik kalian memberi angka 4 angka

play06:37

4 disini artinya lebih tinggi dibanding

play06:40

dengan angka 1 2 dan 3 ya Nah sekarang

play06:45

kita masuk ke uji parametrik dan ujan

play06:48

uji nonparametrik ya Nah pertama jika

play06:52

teman teman mau melakukan analisis data

play06:55

korban Daan dua rata-rata skalanya skala

play06:58

rasio atau interval

play07:00

seks kalau dia berdistribusi normal dia

play07:04

kita menggunakan uji parametrik

play07:05

menggunakan uji-t atau uji-z ya kalau

play07:09

dia tidak berdistribusi normal

play07:11

menggunakan uji wilcoxon atau uji

play07:13

mann-whitney jadi jangan khawatir Jika

play07:16

data teman-teman yang jangkauannya itu

play07:20

di metodenya menggunakan uji-t agar

play07:22

uji-z saat diuji normalitasnya tidak

play07:26

normal maka teman-teman bisa menggunakan

play07:27

uji wilcoxon atau uji mann-whitney u

play07:31

Hai kemudian kalau skalanya ordinal ini

play07:35

perbedaan dua rata-rata setelah ordinal

play07:37

Ya jelas kalau segalanya sudah ordinal

play07:39

langsung menggunakan uji wilcoxon atau

play07:42

uji mann-whitney kemudian perbedaan

play07:45

lebih dari 200 maksudnya adalah di sini

play07:49

ada tiga perlakuan yang kalian

play07:51

bandingkan kalau tadi kan hanya dua

play07:54

Perlakuan di sini ada tiga perlakuan Nah

play07:57

itu menggunakan uji Anova kalau dia

play08:00

berdistribusi normal ya Nah kalau dia

play08:03

tidak berdistribusi normal menggunakan

play08:05

uji kruskal-wallis atau uji trik Man ya

play08:10

Nah kemudian jika ya karena ingin

play08:14

membandingkan lebih dari tiga perlakuan

play08:17

skalanya ordinal itu menggunakan uji

play08:20

kruskal-wallis atau uji treatment ya Nah

play08:25

perbedaan dua rata-rata skalanya nominal

play08:28

ya Nah kalau skala nominal menggunakan

play08:30

uji t

play08:31

kwe atau kwadrat uji magmar atau uji

play08:36

cover kemudian perbedaan multivariat

play08:41

multivariat itu artinya ya variabel

play08:44

tergantung nya atau variabel yang diukur

play08:48

ya itu lebih dari satu ya Nah kalau dia

play08:52

bergizi busi normal menggunakan uji

play08:54

Manova manopause sendiri kepanjangan

play08:56

dari multivariat anak multivariate

play09:00

Analysis of variance ya atau menggunakan

play09:04

uji hotelling kalau datanya tidak berisi

play09:07

busi normal disini tidak dijelaskan

play09:09

ganti dari uji Manova atau hotel yang

play09:12

itu uji apa di teman-teman silakan kalau

play09:15

ada yang sudah membaca referensi

play09:17

silahkan komen ya nanti ya Nah kalau

play09:21

perbedaan multivariat data nominal atau

play09:23

ordinal ini menggunakan uji

play09:25

nonparametrik tapi diri buku ini tidak

play09:27

dijelaskan uji apa uji nonparametrik nya

play09:30

ya

play09:31

Hai Nah kalau penelitiannya mengenai

play09:34

pengaruh variabel terhadap variabel lain

play09:37

pengaruh ya ini datanya skala rasio atau

play09:40

skala interval itu kita menggunakan uji

play09:44

regresi dan uji save jika datanya

play09:48

berdistribusi normal jika datanya tidak

play09:51

berdistribusi normal tidak dijelaskan ya

play09:54

ganti uji dari regresi itu apa aldya

play09:58

Hai Nah kalau penelitian pengaruh ya

play10:01

Fariq terhadap variabel lain datanya

play10:05

nominal Nah kalau datanya nominal ini

play10:07

langsung menggunakan regresi logistik ya

play10:11

kemudian ini penelitian hubungan

play10:14

antarvariabel ya kalau variabel bebas

play10:18

dan variabel terikatnya hanya satu ya

play10:21

skalanya itu rasio atau interval

play10:23

menggunakan korelasi pearson ya kalau

play10:27

dia berbisnis berdistribusi normal kalau

play10:31

tidak berdistribusi normal tidak tidak

play10:33

tahu ya tidak ada dijelaskan ganti dari

play10:35

uji korelasi Vixion untuk uji non

play10:37

parametrik yaitu tidak dijelaskan

play10:39

menggunakan uji apa ya Nah kalau

play10:44

penelitian hubungan antarvariabel ya

play10:46

Variabel terikat dan bebasnya hanya satu

play10:49

datanya skala ordinal kita menggunakan

play10:53

korelasi rank spearman rank spearman

play10:58

nge-review kalau penelitiannya ya

play11:01

peningkatan sini adalah hubungan

play11:03

antarvariabel lagi tapi di sini variabel

play11:06

bebas lebih dari satu dan Variabel

play11:08

terikat hanya satu jadi variabel keknya

play11:11

ada lebih dari satu variabel ininya ada

play11:14

satu maka menggunakan uji korelasi

play11:16

berganda jika dananya normal jika tidak

play11:20

normal juga tidak dijelaskan di buku ini

play11:23

ya kemudian penelitian hubungan antar

play11:27

variabel variabel bebas dan Variabel

play11:29

terikat lebih dari satu ya Nah kalau

play11:32

datanya berdistribusi normal menggunakan

play11:35

korelasi kanonikal Ya saya juga belum

play11:38

tahu nanti saya akan pelajari dan saya

play11:40

akan juga bahas apa itu korelasi

play11:42

kanonikal kalau dia tidak berdistribusi

play11:44

normal tidak dijelaskannya menggunakan

play11:47

uji apa ya Nah ini ada bonus ada uji

play11:53

Yuni varietas dan uji multivariat Apa

play11:56

itu kalau uji

play11:58

Hai univariat itu adalah ujian digunakan

play12:01

untuk mengolah data yang jumlah variabel

play12:04

terikatnya hanya satu ya jika contohnya

play12:07

uji-t gitu ya variabel terikatnya ada

play12:10

satu kalau uji multivariat itu variabel

play12:16

terikatnya lebih dari satu contoh uji

play12:18

hotelling uji multivariat analisis atau

play12:22

menopause kemudian uji same structure

play12:25

question modelling sama korelasi

play12:28

kanonikal ya oke teman-teman eh Demikian

play12:33

Ya video saya kali ini Jadi teman-teman

play12:37

jika teman-teman melihat ada suara kipas

play12:39

angin yaitu memang sengaja karena

play12:43

ternyata saya sudah menemukan penyakit

play12:45

di kamera saya itu adalah dia itu sukat

play12:51

atau sering terjadi overheating ya jadi

play12:54

dia sering mati sendiri jika durasi

play12:58

hanya lebih dari 10 menit kadang saya

play13:00

untuk menjelaskan video statistika ini

play13:03

saya membutuhkan waktu pedang lebih ya

play13:06

dari 10 menit ya jadi saya terpaksa

play13:08

menggunakan kipas angin ya tapi tidak

play13:11

apa-apa ini tidak mengurangi makna dari

play13:15

video yang telah yang saya buat Semoga

play13:18

dengan informasi yang saya berikan di

play13:20

video ini teman-teman jadi paham ya dan

play13:24

tidak khawatir lagi jika datanya tidak

play13:26

berdistribusi normal Ternyata kita bisa

play13:29

menggunakan uji non parametrik Nah tadi

play13:32

ada beberapa uji yang tidak dijelaskan

play13:34

Jika dia tidak berdistribusi normal

play13:37

menggunakan uji nonparametrik nya uji

play13:39

apa gitu ya teman-teman Tolong bantu

play13:42

saya jika teman-teman punya referensi

play13:44

atau punya bukunya Coba kita bahas

play13:47

bersama kita serkan di channel lebih

play13:51

statisika sehingga dapat menjadi

play13:54

informasi atau sumber belajar bagi kita

play13:57

semua

play13:58

I make key demikian video saya kali ini

play14:02

ya Saya ucapkan selamat tahun baru ya

play14:06

Semoga di tahun ini kita dapat jadi

play14:10

pribadi yang lebih baik lagi ya oke

play14:13

demikian video ini saya akhiri

play14:17

wassalamu'alaikum warahmatullahi

play14:18

wabarakatuh dan selamat malam

play14:24

hai hai

Rate This
β˜…
β˜…
β˜…
β˜…
β˜…

5.0 / 5 (0 votes)

Related Tags
StatisticsData AnalysisParametricNonparametricResearch MethodsDescriptiveInferentialData ScalesStatistical TestsQuantitative Research