How To Know Which Statistical Test To Use For Hypothesis Testing
Summary
TLDRThis lecture aims to demystify the selection of appropriate statistical tests for undergraduate students, addressing the common confusion over when to use each test. The instructor lists and explains various tests including one-sample z-tests and t-tests for both means and proportions, two-sample independent tests, matched or paired sample tests, chi-squared tests, regression tests, and one-way ANOVA tests. The focus is on understanding the purpose of each test to determine statistical significance in different scenarios, such as comparing sample means to a known average or examining the impact of treatments in experiments.
Takeaways
- π The lecture introduces various statistical tests typically taught in undergraduate statistics classes.
- π€ Students often struggle to determine which statistical test to use, prompting the need for guidance on their appropriate applications.
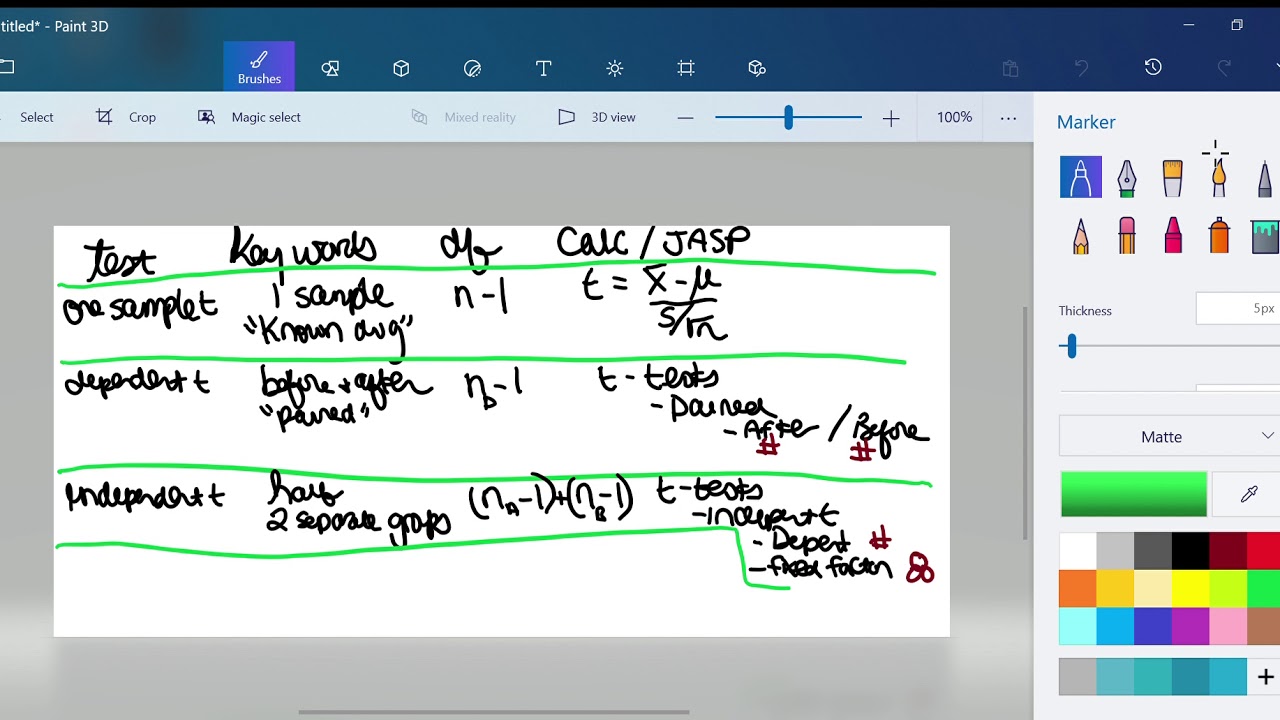
- π The one-sample z-test and t-test for the mean are used to compare a sample mean to a known population mean, with a t-test being more reliable.
- π The one-sample z-test and t-test for proportions are used for comparing sample proportions to known population proportions, with a focus on qualitative variables.
- βοΈ Two-sample independent tests for the mean and proportions are employed to compare averages or proportions between two different groups, such as control and treatment groups in an experiment.
- π Matched or paired sample tests are used when the same group of subjects is measured twice, such as pre- and post-tests, to determine if there's a significant change.
- π Chi-squared tests are designed to assess the relationship between two qualitative variables, which cannot be easily graphed due to their binary nature.
- π Regression tests are used to measure the correlation or association between two quantitative variables, helping to understand how changes in one variable may affect another.
- π§ͺ One-way ANOVA tests extend the concept of the two-sample t-test to compare the means of three or more groups, useful for analyzing the effect of multiple treatments.
- π The lecture emphasizes the importance of understanding when to use each test to avoid incorrect conclusions in statistical analysis.
Q & A
What is the main purpose of the lecture discussed in the transcript?
-The main purpose of the lecture is to introduce various statistical tests typically covered in undergraduate statistics classes and to explain when to use each test.
What are the two types of one-sample tests mentioned for the mean in the transcript?
-The two types of one-sample tests mentioned for the mean are the one-sample z-test and the one-sample t-test.
Why does the lecturer suggest avoiding the use of z-tests?
-The lecturer suggests avoiding z-tests because they make assumptions that are often not valid, and they are generally less reliable than t-tests.
What is the difference between a mean and a proportion in the context of statistical tests?
-A mean is used for quantitative variables and represents the average of a set of numbers, while a proportion is used for qualitative variables and represents the ratio of a particular characteristic within a group.
What is the purpose of the one-sample z-test for proportions?
-The one-sample z-test for proportions is used to determine if the proportion of a certain characteristic in a sample is statistically different from the proportion believed to exist in the population.
What are the two independent sample tests for the mean used for?
-The two independent sample tests for the mean are used to determine if there is a statistically significant difference between the means of two separate groups, such as a control group and a treatment group in an experiment.
How does the two-sample independent test for proportions differ from the test for the mean?
-The two-sample independent test for proportions is used for qualitative variables to determine if there is a significant difference in proportions between two groups, whereas the test for the mean is used for quantitative variables.
What is the key difference between paired sample tests and independent sample tests?
-Paired sample tests involve the same group of subjects measured twice (e.g., before and after an intervention), whereas independent sample tests involve two separate groups that are not related to each other.
What does the chi-squared test help to determine in the context of statistical analysis?
-The chi-squared test helps to determine if there is a relationship between two qualitative variables by analyzing the observed frequencies in a contingency table against expected frequencies.
What is the one-way ANOVA test used for, as explained in the transcript?
-The one-way ANOVA test is used to determine if there are statistically significant differences between the means of three or more independent groups.
Why might a researcher use regression tests in their statistical analysis?
-A researcher might use regression tests to measure the degree of association or correlation between two quantitative variables to understand how changes in one variable are related to changes in another.
Outlines
π Introduction to Statistical Tests
This paragraph introduces the common dilemma faced by students in statistics classes: knowing which of the many statistical tests to use. The lecturer clarifies that the purpose of the lecture is to guide students on when to use various tests typically taught at the undergraduate level. The paragraph lists several statistical tests including one-sample z-tests and t-tests for the mean and proportions, two-sample independent tests for the mean and proportions, matched or paired sample tests, chi-squared tests, regression tests, and one-way ANOVA tests. The lecturer emphasizes the importance of understanding when to apply each test and promises to break down the differences and uses of each test in the course.
π One Sample Tests: Z-Test vs. T-Test
The second paragraph delves into the specifics of one-sample tests, focusing on the z-test and t-test for the mean. The lecturer uses an example of Apple's claim about the average age of its users to illustrate how these tests can be used to compare a sample mean to a known value. The paragraph highlights the subtle differences between z-tests and t-tests, with a strong recommendation against using z-tests due to their stringent assumptions. The t-test is portrayed as the superior choice for determining if a sample mean is statistically different from a hypothesized population mean.
π Two Sample Tests: Independent and Paired
The third paragraph shifts the focus to two-sample tests, which are used when comparing two different groups, such as a control and treatment group in an experiment. The lecturer explains the use of two-sample independent tests for both means and proportions, emphasizing their application in scenarios where the effect of a treatment or intervention is being evaluated. The paragraph also introduces paired sample tests, which are used when the same group of subjects is measured twice, such as before and after a treatment, to determine if there is a statistically significant change.
π§ Advanced Tests: Chi-Squared and ANOVA
The final paragraph covers more advanced statistical tests: chi-squared tests and one-way ANOVA. The chi-squared test is described as a method for determining relationships between two qualitative variables, which cannot be easily graphed or visually analyzed. The lecturer provides an example involving gender and hair color to illustrate how the chi-squared test can reveal correlations between such variables. The one-way ANOVA is introduced as an extension of the two-sample independent test, allowing for the comparison of means across more than two groups, which is useful in experiments with multiple treatments or conditions.
Mindmap
Keywords
π‘Statistical tests
π‘One sample z-test for the mean
π‘One sample t-test for the mean
π‘One sample z-test for proportions
π‘Two sample independent sample tests for the mean
π‘Two sample independent sample tests for proportions
π‘Paired sample tests
π‘Chi-squared tests
π‘Regression tests
π‘One-way ANOVA test
Highlights
Introduction to the variety of statistical tests typically taught in undergraduate statistics classes.
Explanation of when to use different statistical tests, which is a common question among students.
Overview of the one sample z-test for the mean, used to compare a sample mean to a known population mean.
Discussion on the one sample t-test for the mean, its purpose, and why z-tests are generally discouraged.
Clarification on the differences between a z-test and a t-test, and the assumptions they make.
Introduction to the one sample z-test for proportions, used for categorical data.
Explanation of the one sample t-test for proportions and its application in polling and surveys.
Description of two independent sample tests for the mean, used in experiments with control and treatment groups.
Details on two independent sample tests for proportions, used to compare categorical outcomes between groups.
Explanation of the paired sample test, also known as the matched or repeated measures test.
Discussion on the chi-squared test, used to determine relationships between two categorical variables.
Introduction to regression tests, which measure the association between two quantitative variables.
Overview of the one-way ANOVA test, an extension of the two sample t-test for comparing more than two groups.
Emphasis on the importance of understanding the purpose of each test to know when to use them appropriately.
Promise of upcoming lectures to delve deeper into the conduct and application of these statistical tests.
Transcripts
[Music]
so in most statistics classes students
are supposed to learn a dozen or so
statistical tests and a really great
question I get from my students every
semester is how do I know which tests
I'm supposed to use and that's a great
question considering there's like a
dozen of them and if you just learn all
of the different statistical tests then
you end up leaving a statistics class
thinking I mean I know all these tests
but I just don't know which one to use
and when so this lecture is going to be
dedicated to introducing the different
types of statistics tests specifically
the ones that are typically involved in
undergraduate level statistics classes
and when to use them so I'm going to
first run through all the different
tests that we will be covering
throughout this course and then I'm
going to analyze when to use which one
so there are one sample z-test for the
mean one sample t-test for the mean one
sample z-test for proportions one sample
t-test for proportions two sample two
independent sample tests for the mean
two independent sample tests for
proportions matched or paired sample
tests chi-squared tests regression tests
and one-way anova tests that's a huge
list of tests and it could kind of be
overwhelming and I understand that it
took me a while to be able to understand
which one to use and when so in order to
do that I'm gonna break down all these
different tests explain what they are
what their purposes are and that should
hopefully clarify when to use which test
so let's start with the first category
of tests there are two tests in this
category this is the one sample
z-test
for the mean
and there is the one sample
she tests that's not how you spell test
for the mean
now these two tests are really similar
to each other I'm gonna break down the
differences in a second here but let me
first address what this does
suppose Apple claims that the average
age of their user was like 45 now you
and I both know that's not correct
so suppose we gather like a sample of
like a thousand Apple users and we find
the average age we have this average I
want to clarify that we are calculating
a mean here and we're trying to compare
that mean to what the scientific
community believes in so the scientific
community right I guess in this case
Apple believes that the average is 45
and we're trying to prove them wrong
we're trying to say now you say it's 45
I don't think it's 45 I actually think
it's not 45 I think it might be around
20-something right so you gathered a
large sample you calculate the average
you notice the average is different than
45 and then these tests will allow you
to determine if the difference between
the averages the average that you
calculate with your sample and apples
claim which is 45 these two tests will
determine whether that those two numbers
are different from each other now what's
the difference between a Z test and a T
test
it's a great question pretty much
nothing um so let me explain what I mean
by that first off Z tests in general are
terrible they suck they make
the math a little bit easier but no one
should ever use a z-test if you ever see
z-test in general just avoid them like
the plague because they make assumptions
that should never be made in the first
place
typically T tests are way better if I
ever read a research paper that involves
any statistics test I will never see a Z
test and if I do I'm gonna start
questioning the authority of what the
paper is trying to say so we're gonna
talk about this later on but just for
now I'll just understand that the one
sample T test for the mean is the
purpose of that is to determine whether
your sample average is statistically
significant than what everyone thinks
the average is now let's move on to the
next category the next category is very
similar it's the one one sample Z test
for in this case not the mean but the
for a proportion
now what's the difference between a mean
and
portion
a proportion is meant for rather
qualitative variables so for example I'm
interested in maybe are you a Republican
or are you not a Republican that kind of
question is a qualitative question and
if I gather a huge sample I can't really
compute an average like I would compute
a proportion of Republicans so for
example if I gather at a thousand people
I wouldn't say that the average is like
Republican
you can't really compute average if the
responses are all qualitative you have
Republicans and not Republicans same
thing with gender if you gather a huge
group of people and you want to know you
want to know information about the that
group of people in terms of their gender
you have male and female right and the
idea is you can't really calculate the
average you can't add up all the numbers
and divide by the total number of
numbers because the responses aren't
numbers they're qualitative responses
and so you can make it quantitative by
calculating a proportion so you might
say okay well fifty percent of the
sample was male or fifty-one percent of
the sample was male or you might say 70
percent of the of the sample was not
Republican and so now you have something
to work with and so these type of tests
are more for qualitative variables and
the same principle applies let's say for
example in the 2016 election there are
all of these claims that Hillary Clinton
was gonna win the election on and let's
say people were saying that she was
gonna win and people were certain that
she was gonna win by like I don't know
it was like 50 electoral votes or
something like that or that 60 something
65 percent of the people we're gonna
vote for Hillary Clinton well that
wasn't the case was it those those
proportions were incorrect
those polls in a sense were incorrect or
the way they conducted their polling was
poor in a sense it wasn't representative
of the actual population and so the idea
is if someone comes out and says no I
disagree with this this claim about the
proportion of people who are gonna vote
for Hillary Clinton I have a different
proportion I think it's actually 45%
now are those two proportions different
from each other that's what these tests
measure these test measure is your
proportion of your sample you're one
sample different from what everyone
believes the proportion is
let me give you one more example 75% of
the people claim to be Christian in the
u.s. at least in the US on what might be
interesting is to say I don't think it's
75% I think it's a different percentage
so you can't you gather a group of like
1000 people you calculate what
proportion of that sample is Christian
you find it's 60% now the next question
is is 60% different from 75% or should I
say is it different enough to say yeah
it's not 75% it's 60% and that's what
these tests can do but once again what's
the difference between a Z test and a
t-test I'll tell you it's us of
sloppiness if you use this then you're
sloppy I know that sounds crazy but
that's actually legit if you use a
z-test ever I'm just I'm baffled why you
would ever use something like that so um
so far we've gone over four different
tests and these are all with one sample
but let's talk about what you do with
multiple samples and this is where
things get kind of interesting so first
let's talk about the two independent
sample tests for the mean so I'm going
to write that down the two sample
independent test
for the mean
so this is really useful if you're
conducting an experiment
whenever you're conducting an experiment
you typically will have a control group
and a treatment group you will have two
samples
and you want to know are these samples
are the results of these samples
statistically significant
and so you want to measure the mean of
this group mean one and the mean of this
group mean two and the question is are
these two averages different from each
other different enough to suggest that
whatever the treatment was it made a
difference so for example suppose you
found a cure to cancer
and you notice that the results of one
group all these people are getting cured
and the other group not so much on the
control group the you know no one's
getting cured right you might notice
that hey my treatment does something
here and it's statistically significant
that's the kind of thing that we're
dealing with when we talk about two
sample tests in general now this is a
two sample test for the mean so cancer
might only work for proportions like we
would say well 50% of the report 50% of
the people here were cured and the other
50% we're not you know that's more
proportion stuff I might be more
interested in let's say how much
cholesterol is in at the average
cholesterol in each group after giving a
certain medication and I notice that the
average cholesterol and the treatment
group was significantly smaller than the
cholesterol and the other group and so
you might say this medicine lowers
cholesterol because the two samples here
these two samples have statistically
significant differences and therefore
the treatment can be that the the thing
that we associate to why there is a
difference
likewise there is a two-sample
independent test for proportions
and so you could probably guess what
this is going to be in this case instead
of measuring sample averages we're
measuring proportions
we have proportion 1 in proportion to so
for example we're measuring whether or
not
maybe something qualitative are you
depressed might be the question and we
give one group the control group a
placebo
and we give the other treat a group the
treatment group some antidepressants
some things that make people anti
depressed and in both groups we gather
maybe some people who claim to be
depressed or they're considered
oppressed and we want to see does this
antidepressant act
antidepressant actually affects
something well at the end of the gun of
the study we asked the question are you
sad but saying or are you depressed and
we notice that the treatment group has a
higher proportion of people who say yeah
I feel better now I don't I don't feel
sad whereas the control group you have
just the same amount and you notice
those two proportions are now
statistically significant and that's how
you can associate the treatment to the
cause of why the proportion is now
different
so so far we're over we're pretty much
almost done with all the different types
of statistics tests let's talk about the
paired sample test or sometimes is
referred to as the matched
or paired
sample test
now this is very similar to the two
sample on tests for the mean or the
proportion what we just talked about but
in this case the samples are typically
the same group of people they're not
independent of each other they're not
like completely different samples in
fact typically it's the same sample but
measured twice so for example I might be
interested in an average before
and an average after
and I might be interested in did the
average actually change enough was there
a change in this
in this experiment and that's what this
test can measure so in this case the
samples are not independent of each
other
they're actually dependent of each other
and typically they're the same sample so
for example maybe I have a classroom and
I want to know whether or not my lecture
improves the the test score of my math
test and so what I do is I give a
pretest and I get an average before and
then I do my lecture and then I give the
test again and I calculate the average
after and so now the question is are
those averages statistically significant
from each other
and so in this case again the two
samples are dependent on each other they
are not independent of each other so
that's the slight difference here
next up we have the chi-squared test now
let's talk about the regression test
before we go into the chi-square test
I'm gonna switch these up a little bit
let's talk about the regression test
so you've probably heard regression at
some point maybe in high school
mathematics this is typically taught in
high school math or at least it should
be according to the Common Core
Standards but the idea is we have two
variables and they're both quantitative
and we want to measure do these two
variables have any sort of association
with them is there any sort of
correlation involved and regression will
help you determine how correlated or how
associated two variables are so you have
variable one X and variable two Y and
you want and they're both quantitative
and the idea is for every dot here every
single dot represents you measuring both
x and y simultaneously so for example I
might want to calculate your age and
your GPA and I would plot that on this
graph and I do that with every one I
measured their age and their GPA age GPA
and I graph all these points and I I'm
interested in whether or not age has
anything to do with GPA
and so that's what regression is now
oops I just completely exited out that
let me pull that back up this is my this
is my control panel for all of you who
are interested in that alright let's go
back to this very good let's talk about
the chi-squared test the chi-squared
test is very similar
the chi-square test determines if there
is a relationship with two variables
that are qualitative so for example in
this case I'm not going up to you and
I'm not going to ask you quantitative
questions I'm actually gonna ask you
qualitative questions so in this case I
might ask you are you let me see if I
can get this rate
let's do there we go
yeah so are you male are you female but
I'm gonna ask you two questions I'm
gonna ask you what's your gender but I
might also ask you let's say are you
blonde
or not blonde
and I wanted to determine is there a
relationship between your gender and
your hair color
now it's really hard to determine that
if there's a relationship because those
aren't quantitative you can't measure
them on a graph you can't draw up plot
points because these variables are
binary there are only two options and so
in this case maybe we notice that there
are on you know a hundred male male
blondes but only two males that are not
blonde and three females that are blonde
and 250 females that are not blonde in
this example we noticed that if you're
male you're probably gonna be a blonde
and if you're a female you're probably
gonna be not blonde there's sort of a
relationship here there's a correlation
between these two variables but it's
hard to see there because we can't
really graph it there's no way to graph
this and so the chi-squared test can
solve this problem by allowing us to
determine whether or not two qualitative
variables are different from each other
now last but not least
have the one-way ANOVA test
I'll just do one way
ANOVA test now many many statistics
classes will not go this far they will
stop before we even get here but every
once in a while I'll see a statistics
class that will talk about the one-way
ANOVA test so let me explain what the
one-way ANOVA test is the idea is the
one the ANOVA test in general is the
same thing as I'll even write this down
ANOVA is the same thing as the two
sample
independent test
independent there we go test so if you
remember the two sample two independent
test was you have two samples that are
not the same samples maybe like a
treatment group in a control group and
you want to know whether or not the
treatment group makes us it makes some
sort of difference and in the results
well the ANOVA test is exactly the same
thing except instead of two samples
typically we would do some like n
samples so maybe we have all sorts of
different medications we have a control
group treatment one treatment two
treatment three we want to try all sorts
of different things the one-way ANOVA
test can help us do that
we want to see which of the different
treatments is going to affect the
results that are quantitative in nature
so again it's very it's basically the
concept of the two sample independent
t-test but instead of a treatment group
in a control group we would have control
group srimad group one treatment group
two treatment group three and we want to
know are those groups statistically
significant from each other and that's
what it'd be ANOVA test is for now in
the upcoming lectures we're gonna be
talking about the many different all of
these statistics tests and we're gonna
explain how to conduct them and you know
I'm gonna re-emphasize their purposes
again so that we get a better
understanding of when to use them as
well anyways thank you guys so much
I'll seen the next lecture
Browse More Related Video
T-test, ANOVA and Chi Squared test made easy.
uji hipotesis rata-rata 2 populasi (sampel independen)
t-Test - Full Course - Everything you need to know
Perbedaan Statistika Parametrik dan Non Parametrik
T-Tests: A Matched Pair Made in Heaven: Crash Course Statistics #27
Hypothesis Testing In Statistics | Hypothesis Testing Explained With Example | Simplilearn
5.0 / 5 (0 votes)