Probabilitas dan Statistik: 8.8 Central Limit Theorem Contoh
Summary
TLDRThis video explains the Central Limit Theorem (CLT) with practical examples. It covers how the sample mean tends to follow a normal distribution as sample size increases, even if the population distribution is not normal. Examples include assessing internet service performance, diagnosing hypokalemia with potassium levels, and calculating travel time probabilities. It illustrates how to calculate probabilities using Z-scores and explains the importance of CLT in making more accurate statistical predictions. The video also touches on hypothesis testing and statistical estimation using CLT, showcasing its applications across various fields.
Takeaways
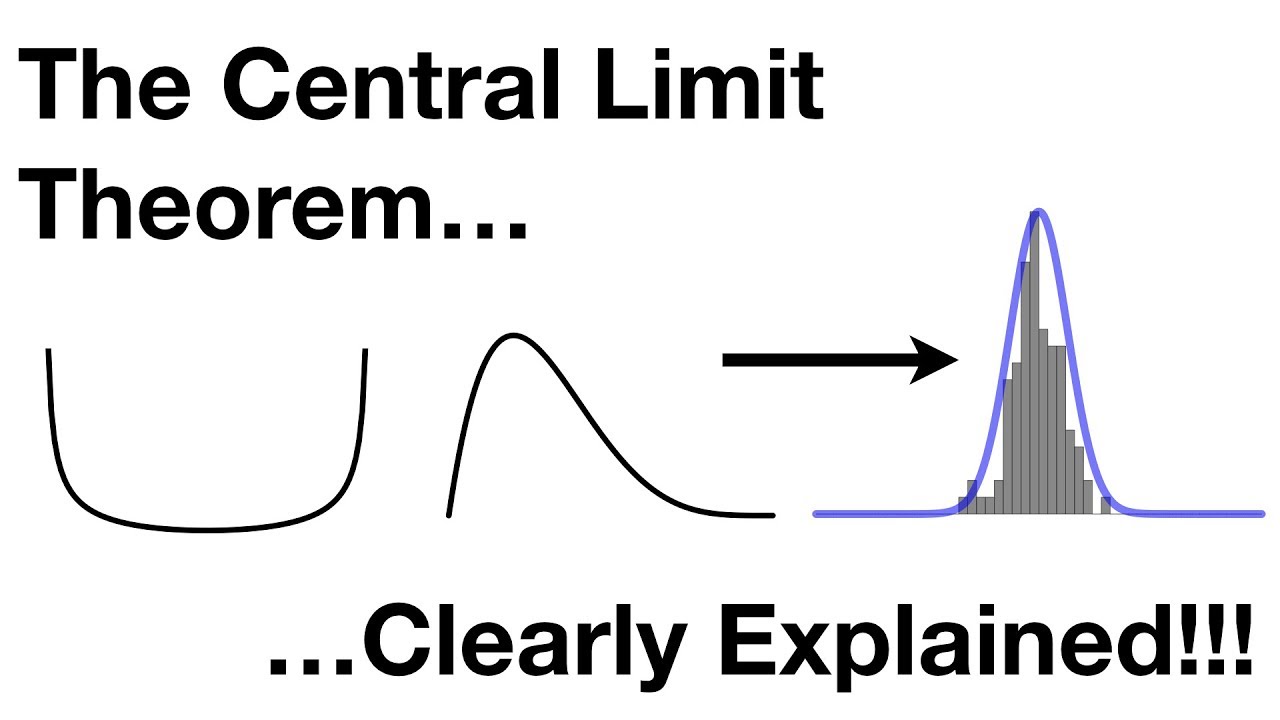
- 😀 The Central Limit Theorem (CLT) states that the distribution of sample means will be normally distributed, even if the population distribution is not normal.
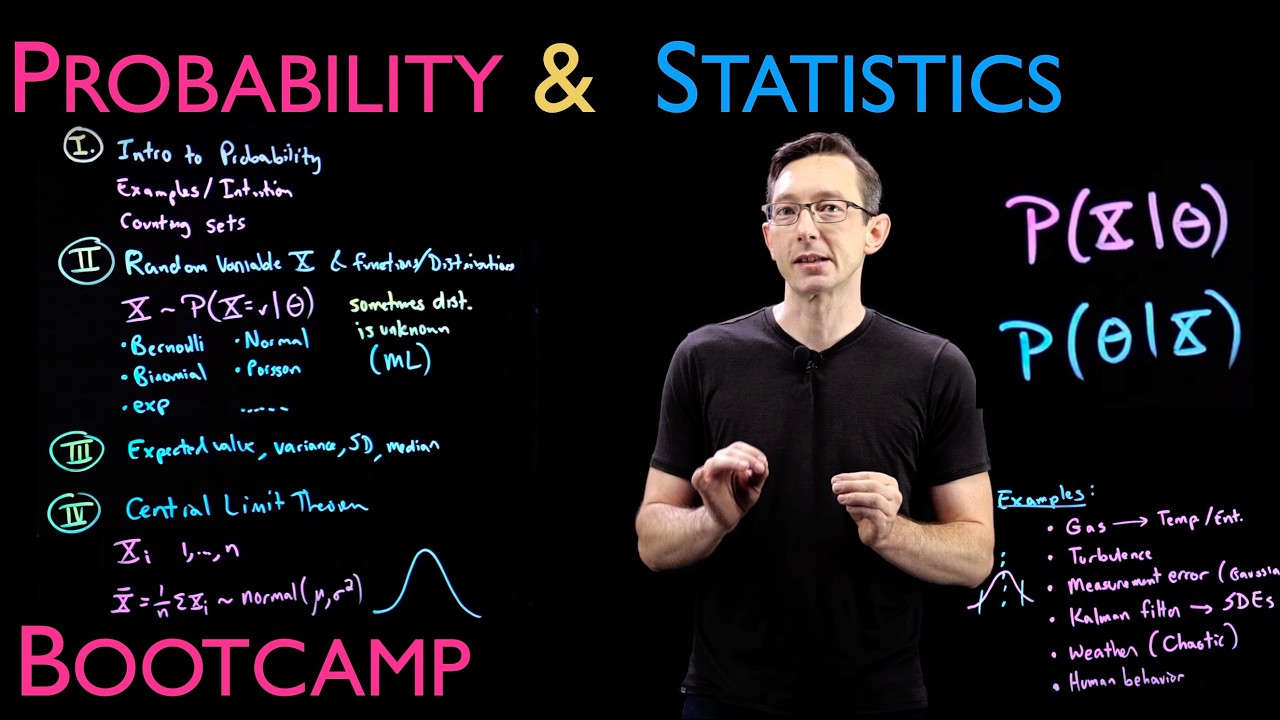
- 😀 The sample mean is treated as a random variable, and the Z-score formula (z = x̄ - μ / σ/√n) is used to standardize it.
- 😀 An example is provided with video streaming data to illustrate the application of the Central Limit Theorem for evaluating the performance of an internet service provider.
- 😀 In the given example, the population mean is 0.82 MB/sec, and the population variance is 0.79 MB/sec, which are used to calculate probabilities using the CLT.
- 😀 The probability of obtaining an average sample less than 0.8 MB/sec is calculated using the Z-score and CLT principles.
- 😀 Another example discusses the diagnosis of hypokalemia, where the CLT is used to calculate the probability of misdiagnosing a person based on a single measurement or multiple measurements.
- 😀 For the hypokalemia example, when taking 1 measurement, the chance of misdiagnosis is 6.8%, but with 4 measurements, the chance reduces to 1.3%.
- 😀 The Central Limit Theorem improves accuracy in predictions as the sample size increases, as shown by the decreasing misdiagnosis probability in the hypokalemia case.
- 😀 In the example of travel times between campuses, the CLT is used to calculate the probability of the average travel time exceeding 60 minutes based on a sample of 40 trips.
- 😀 By using the CLT, the probability that the average travel time exceeds 60 minutes is calculated to be 5.7%, showing a relatively low chance of this happening.
- 😀 The script emphasizes how the Central Limit Theorem can be applied to two populations, enabling hypothesis testing and statistical estimation for comparisons.
Q & A
What does the Central Limit Theorem (CLT) state?
-The Central Limit Theorem states that the distribution of the sample mean will tend to be normally distributed, regardless of the original population's distribution, as the sample size increases. This allows for the use of normal distribution even when the underlying data isn't normal.
How does the Central Limit Theorem apply to internet service performance?
-In the example of internet service performance, CLT is used to determine the probability of obtaining an average sample internet speed less than 0.8 MB/s, given a population mean of 0.82 MB/s and a variance of 0.79 MB/s². Using the Z-score formula, the probability is calculated for such an event.
What is the significance of the Z-score in CLT?
-The Z-score is used to measure how many standard deviations the sample mean is away from the population mean. It is essential for calculating probabilities and making inferences about the sample mean's position within a normal distribution.
How is the probability of misdiagnosing hypokalemia calculated using CLT?
-In the hypokalemia example, the probability of a misdiagnosis is determined by calculating the Z-score for a single measurement and then using CLT to find the probability of a wrong diagnosis with multiple measurements. The probability decreases with more measurements, improving diagnostic accuracy.
What happens to the probability of misdiagnosis as the number of measurements increases?
-As the number of measurements increases, the probability of misdiagnosis decreases. For instance, while the probability of misdiagnosis with one measurement is 0.068, with four measurements it drops to 0.013, significantly reducing the chances of an error.
What is the role of sample size (n) in CLT?
-Sample size plays a critical role in CLT. A larger sample size leads to a more accurate estimate of the sample mean's distribution, which approaches a normal distribution as n increases. In the examples, increasing the number of samples leads to more accurate probability calculations and better decision-making.
How is CLT applied in the travel time example between ITB Ganesha and Jatinangor?
-In the travel time example, CLT is applied to calculate the probability that the average travel time exceeds 60 minutes, given an average travel time of 55 minutes and a standard deviation of 20 minutes. This uses the Z-score formula to determine the likelihood of observing a sample mean greater than 60 minutes.
What is the significance of the 5.7% probability in the travel time example?
-The 5.7% probability indicates that, in about 1 out of 20 weeks, the average travel time will exceed 60 minutes. This provides a statistical understanding of how unusual or common a travel time over 60 minutes would be, given the population data.
Why is it important to use CLT when dealing with sample data?
-Using CLT is important because it allows for making inferences about the population from a sample, even when the population data isn't normally distributed. By assuming that the sample mean follows a normal distribution for large sample sizes, we can calculate probabilities and test hypotheses with more accuracy.
How does CLT help in hypothesis testing and statistical estimation?
-CLT is fundamental in hypothesis testing and statistical estimation as it allows for the use of normal distribution to make inferences about population parameters. By understanding how sample means are distributed, it becomes easier to assess whether observed data supports a hypothesis or estimate the value of a population parameter based on sample data.
Outlines

This section is available to paid users only. Please upgrade to access this part.
Upgrade NowMindmap

This section is available to paid users only. Please upgrade to access this part.
Upgrade NowKeywords

This section is available to paid users only. Please upgrade to access this part.
Upgrade NowHighlights

This section is available to paid users only. Please upgrade to access this part.
Upgrade NowTranscripts

This section is available to paid users only. Please upgrade to access this part.
Upgrade Now


5.0 / 5 (0 votes)