THE CENTRAL LIMIT THEOREM
Summary
TLDRThis video script explains the Central Limit Theorem (CLT) with an example involving sample means. It demonstrates how for a sample size of 30 or more, the sample mean follows a normal distribution, with a mean equal to the population mean and a standard deviation based on the population standard deviation divided by the square root of the sample size. Using the CLT, the video calculates the probability of sample means falling within specified ranges, converting observed values to Z-scores, and finding areas under the normal curve to determine probabilities.
Takeaways
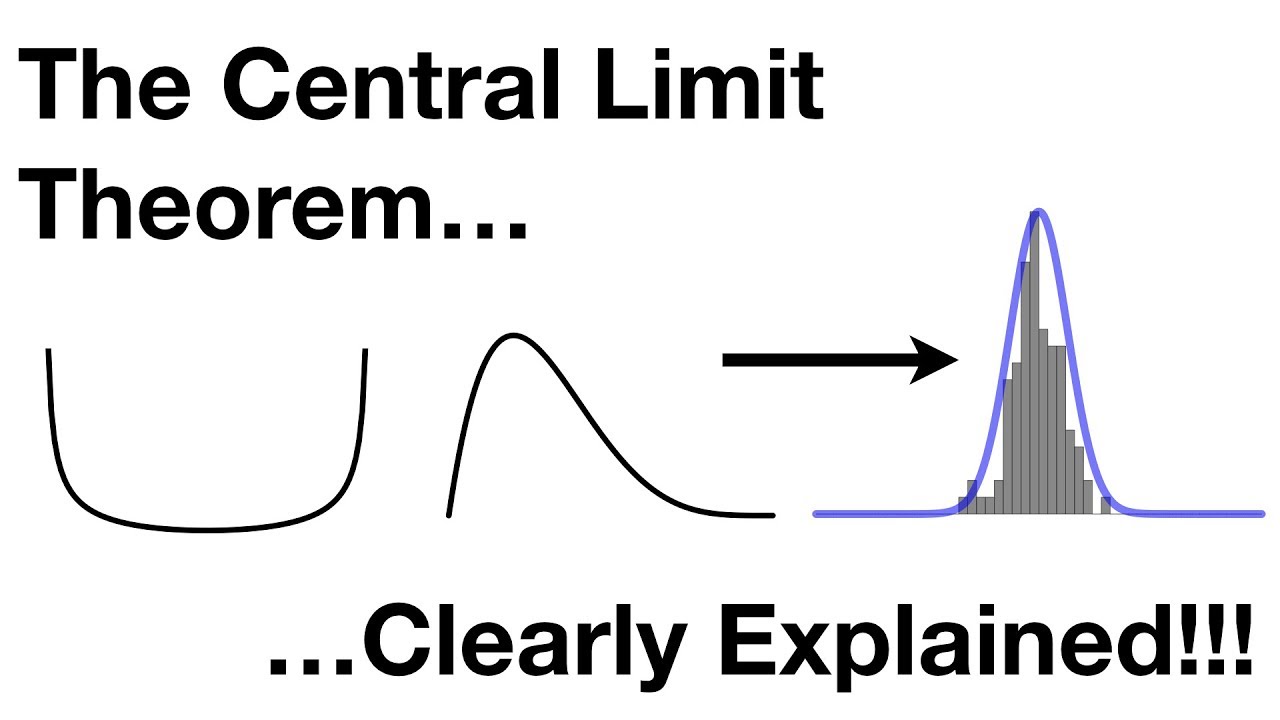
- 😀 The central limit theorem states that for samples of size 30 or more, the sample mean is approximately normally distributed.
- 😀 The sample mean equals the population mean, and the sample standard deviation is the population standard deviation divided by the square root of the sample size.
- 😀 The formula for calculating the sample standard deviation is the population standard deviation divided by the square root of the sample size.
- 😀 Z-scores can be used to calculate probabilities for sample means by converting observed values into standard normal scores.
- 😀 The formula for the z-score is (observed value - sample mean or population mean) / sample standard deviation.
- 😀 To calculate the probability of the sample mean being between two values, convert both values to z-scores and find the corresponding areas under the normal curve.
- 😀 The probability between two z-scores is the sum of the areas corresponding to each z-score under the normal distribution curve.
- 😀 In the case of a probability greater than a certain value, find the z-score for the value and calculate the area to the right of it.
- 😀 For probabilities less than a certain value, find the z-score and calculate the area to the left of it on the normal distribution curve.
- 😀 The probability for a sample mean greater than a specific value is obtained by adding half of the curve's area (0.5) to the area to the right of the z-score.
- 😀 For the given examples, the probability calculations show the likelihood of the sample mean falling between certain values, greater than, or less than a given number.
Q & A
What is the Central Limit Theorem?
-The Central Limit Theorem states that for samples of size 30 or more, the sample mean is approximately normally distributed. The sample mean equals the population mean, and the sample standard deviation is the population standard deviation divided by the square root of the sample size.
What formula is used to calculate the sample standard deviation from the population standard deviation?
-The formula to calculate the sample standard deviation is the population standard deviation divided by the square root of the sample size: Sample Standard Deviation = Population Standard Deviation / √(Sample Size).
How is the Z-score calculated for a given sample mean?
-The Z-score is calculated using the formula: Z = (Observed Value - Population Mean) / Sample Standard Deviation. This tells us how many standard deviations an observed value is from the population mean.
What is the Z-score for a sample mean of 112 when the population mean is 120 and the sample standard deviation is 5.895?
-For a sample mean of 112, the Z-score is calculated as (112 - 120) / 5.895 = -1.38.
What is the probability that the sample mean will lie between 112 and 125?
-The Z-scores for 112 and 125 are -1.38 and 0.86, respectively. Using these Z-scores, the probability that the sample mean lies between 112 and 125 is approximately 72.13%.
What does a Z-score of -0.52 represent in terms of probability?
-A Z-score of -0.52 corresponds to a cumulative probability of 0.3015. Since the Z-score is negative and we're looking for values greater than -0.52, the probability is 0.3015 plus 0.5, resulting in a total probability of 69.85%.
How is the area under the normal curve used to calculate probabilities?
-The area under the normal curve represents the cumulative probability. To calculate the probability for a given range, we use the Z-scores to find the corresponding areas, then subtract or add those areas depending on the range being considered.
What is the Z-score for a sample mean of 110 when the population mean is 120 and the sample standard deviation is 5.895?
-The Z-score for a sample mean of 110 is calculated as (110 - 120) / 5.895 = -1.72.
What is the probability that the sample mean will be less than 110?
-The Z-score for 110 is -1.72, and the corresponding area under the normal curve is 0.4573. Since we're looking for the probability less than 110, the probability is 0.5 - 0.4573, which is 4.27%.
Why is it necessary to convert values into Z-scores when using the normal distribution?
-Converting values into Z-scores standardizes them, making it easier to use the standard normal distribution to find probabilities. Z-scores provide a way to compare different values on the same scale, regardless of the population's original mean and standard deviation.
Outlines

This section is available to paid users only. Please upgrade to access this part.
Upgrade NowMindmap

This section is available to paid users only. Please upgrade to access this part.
Upgrade NowKeywords

This section is available to paid users only. Please upgrade to access this part.
Upgrade NowHighlights

This section is available to paid users only. Please upgrade to access this part.
Upgrade NowTranscripts

This section is available to paid users only. Please upgrade to access this part.
Upgrade Now


5.0 / 5 (0 votes)