❌ Stop Using RSI 👀 Use This SECRET Indicator Instead
Summary
TLDRIn this video, the Range Expansion Index (REI), a unique oscillator introduced by Thomas Demark, is explored as an alternative trading indicator. Unlike conventional indicators that use the close price, REI incorporates both high and low prices of a bar, offering distinctive signals. The video details how the REI can be used in strategies for long or short positions and compares its effectiveness against traditional indicators like RSI. With optimization techniques, a trading strategy is built around the REI, showing its potential to generate different equity curves and improve strategy performance with filters like volume oscillators.
Takeaways
- 😀 The Range Expansion Index (REI) is an oscillator created by Thomas Demark, using intraday high and low rather than just the close, providing a unique perspective on market movement.
- 😀 The REI indicator can serve as a filter or signal generator for trading strategies, offering a different approach compared to traditional indicators like RSI2.
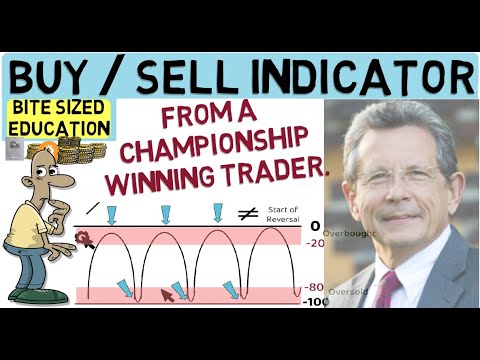
- 😀 The REI ranges from -100 to 100 and uses a look-back period along with overbought and oversold levels to generate buy and sell signals.
- 😀 Unlike traditional indicators that use only closing prices, REI uses both intraday highs and lows, making it unique and potentially more responsive to short-term market movements.
- 😀 The script demonstrates how to optimize a strategy based on the REI indicator, such as adjusting the look-back period and oversold/overbought levels to maximize performance.
- 😀 Through optimization, different combinations of look-back periods and levels were tested, showing that multiple configurations can be profitable, though some are more efficient than others.
- 😀 The REI indicator can be used for mean reversion strategies (buy when oversold, sell when overbought), with an option to implement stop-losses or limit trade duration.
- 😀 Even with stop-losses or trade duration limits, the strategy maintains profitability with minimal reduction in performance, showing the robustness of the REI approach.
- 😀 Combining the REI with volume or volatility filters can further enhance a strategy’s performance, improving metrics like return-to-drawdown ratio and win rate.
- 😀 Comparing the REI strategy with the classic RSI2 strategy shows that both strategies produce similar net profits but with different equity curves and drawdowns, providing diversification opportunities.
- 😀 The goal of using different indicators, like the REI, is to generate distinct equity curves with the same edge in the market, improving strategy robustness and trade diversity.
Q & A
What is the Range Expansion Index (REI)?
-The Range Expansion Index (REI) is an oscillator created by Thomas Demark, which measures intraday price movements by considering the high and low of a bar, rather than just the close price. This makes it different from many traditional indicators that only use the close price.
How does the REI differ from traditional indicators like RSI?
-The REI differs from the RSI by using the high and low of a bar to calculate its values, while the RSI only uses the close price. This results in unique signals and a different perspective on market movements compared to indicators like the RSI.
What is the core argument behind the creation of the REI?
-Thomas Demark argued that most indicators rely solely on the close price, which overlooks intraday price movements. By using the high and low of each bar, the REI provides a more comprehensive view of price action throughout the day.
Can the REI be used for both long and short strategies?
-Yes, the REI can be adapted for both long and short strategies. For example, in a long strategy, you can look for pullbacks or breakouts using the REI, while in a short strategy, you can wait for high readings to short or low readings for breakout opportunities.
How does the use of unique indicators like the REI impact a trading strategy?
-Using unique indicators like the REI allows traders to create different equity curves for the same strategy, helping to reduce losses or improve performance during specific market conditions. For instance, the REI may produce better results during certain periods compared to other indicators like the RSI.
What does the optimization process for the REI strategy look like?
-The optimization process involves adjusting parameters like the lookback period, overbought level, and oversold level. By testing different combinations, traders can identify the most effective settings for their strategy. For example, the best-performing combination found in the script had a lookback period of 2 and an oversold level of 10.
What is the strategy that the REI is used for in the video?
-The strategy involves buying when the REI oscillator falls below the oversold level and exiting when it rises above the overbought level. This strategy is tested on S&P 500 E-mini futures since 2007, and adjustments like a stop-loss or exit after a number of bars are made to improve performance.
What is the role of the volume oscillator in the strategy?
-The volume oscillator is used as a filter to reduce the number of trades and increase the strategy's return-to-drawdown ratio. When added to the REI strategy, it helped reduce the number of trades by about 40%, but the overall performance improved, especially in terms of the return-to-drawdown ratio.
What kind of performance does the strategy using the REI show?
-The strategy using the REI shows a win rate of 65% with an average profit of 360. It has been tested from 2006 up to April 2025, with an equity curve showing consistent growth. Adding the volume filter improved the strategy, increasing the win rate to 69% and the average trade profit to 530.
What is the significance of using different indicators on the same edge and market?
-Using different indicators on the same edge and market produces a different equity curve, which can help reduce drawdowns and improve consistency. For example, the REI strategy and the RSI strategy on the same market can generate different performance results, helping traders diversify risk and optimize returns.
Outlines

This section is available to paid users only. Please upgrade to access this part.
Upgrade NowMindmap

This section is available to paid users only. Please upgrade to access this part.
Upgrade NowKeywords

This section is available to paid users only. Please upgrade to access this part.
Upgrade NowHighlights

This section is available to paid users only. Please upgrade to access this part.
Upgrade NowTranscripts

This section is available to paid users only. Please upgrade to access this part.
Upgrade NowBrowse More Related Video
Williams R Trading Indicator Back test - Beats the S&P 500!

15 Best Trading Indicators on Pocket Option

Best AI TradingView Indicator in 2024 | 100% Winning Strategy 🔥

This NEW Indicator Is Beyond Your Imagination! It Will Blow Your Mind!

This FREE Indicator Predicts Reversals!

What BMI doesn't tell you about your health
5.0 / 5 (0 votes)