Ekonomi Kelas X - Harga Keseimbangan
Summary
TLDRThis educational video explains the concept of equilibrium price in economics, demonstrating how the price at which the quantity demanded equals the quantity supplied is determined. Through a graphical approach, it shows the intersection of the demand and supply curves, forming the equilibrium point. The video also walks through a practical example using specific demand and supply functions to calculate the equilibrium price (9) and quantity (13). This tutorial helps viewers understand the basics of market equilibrium and how to graphically represent and calculate it.
Takeaways
- 😀 Price equilibrium refers to the price where the quantity demanded equals the quantity supplied in a market.
- 😀 In a market, there are buyers and sellers, and the exchange between them leads to a price that both parties agree upon.
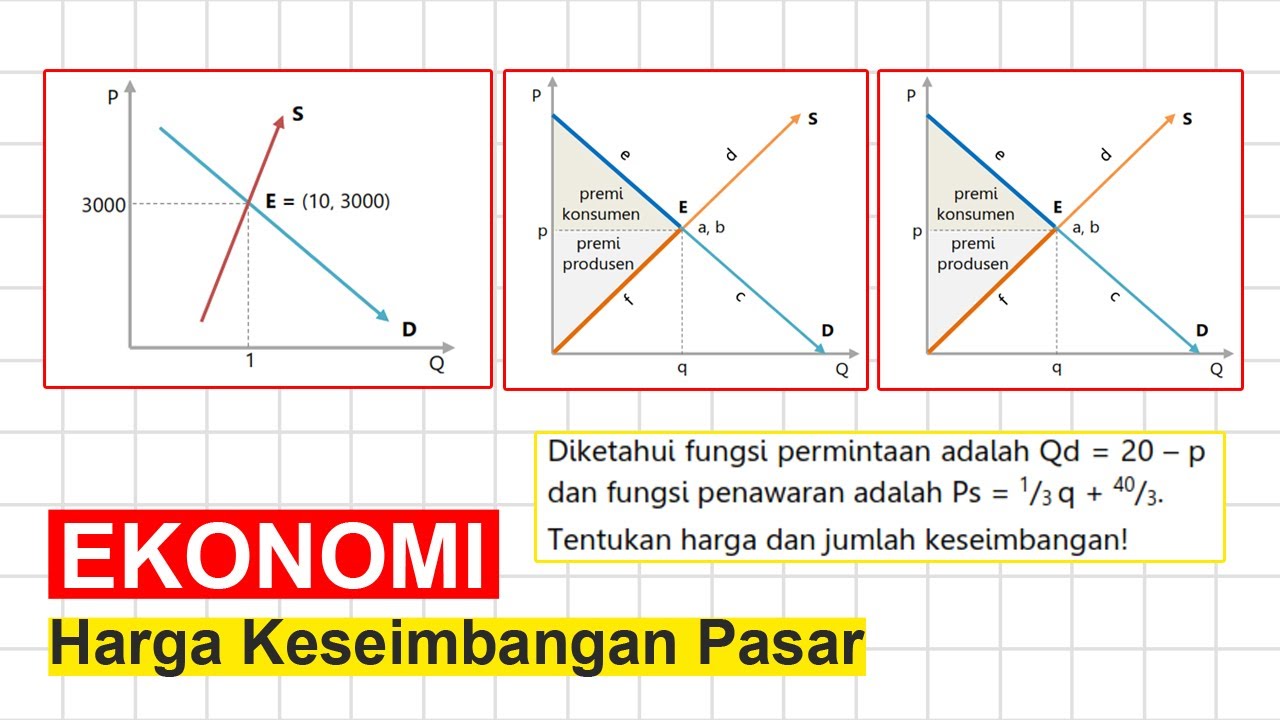
- 😀 Price equilibrium occurs when the demand curve and supply curve intersect, creating a point of balance.
- 😀 The equilibrium price is the price at which the quantity demanded by consumers is equal to the quantity supplied by producers.
- 😀 The equilibrium quantity is the number of units bought and sold at the equilibrium price.
- 😀 A market’s equilibrium can be represented using a graph with the price on the vertical axis and the quantity on the horizontal axis.
- 😀 The demand curve slopes downward, while the supply curve slopes upward, reflecting how price influences quantity demanded and supplied.
- 😀 The point where the demand and supply curves intersect is called the equilibrium point, which determines the equilibrium price and quantity.
- 😀 To calculate the equilibrium price, we use the demand and supply functions and set the quantity demanded equal to the quantity supplied.
- 😀 An example calculation involves solving the demand equation (QD) and supply equation (QS) to find the equilibrium price, then substituting that value to find the equilibrium quantity.
Q & A
What is the concept of price equilibrium in economics?
-Price equilibrium, or equilibrium price, refers to the price at which the quantity of a good demanded by consumers equals the quantity supplied by producers. It is the price at which the market reaches balance, with no excess demand or supply.
How can price equilibrium be represented graphically?
-Price equilibrium can be represented graphically by the intersection of two curves: the demand curve (D) and the supply curve (S). The point where these curves intersect represents the equilibrium price and quantity.
What are the main components involved in the market equilibrium?
-The main components involved in market equilibrium are the buyers (consumers), sellers (producers), and the transaction that occurs when the price is agreed upon. The interaction between supply and demand determines the equilibrium price and quantity.
What does the demand curve represent in the equilibrium model?
-The demand curve represents the relationship between the price of a good and the quantity that consumers are willing to purchase at each price level. It typically slopes downward, indicating that as prices decrease, demand increases.
What does the supply curve represent in the equilibrium model?
-The supply curve represents the relationship between the price of a good and the quantity that producers are willing to sell at each price level. It typically slopes upward, indicating that as prices increase, supply increases.
What is the role of the intersection point in the equilibrium model?
-The intersection point of the demand and supply curves represents the equilibrium point, where the quantity demanded equals the quantity supplied. This point determines the equilibrium price and quantity in the market.
How is the equilibrium price calculated using demand and supply functions?
-The equilibrium price is calculated by setting the demand function equal to the supply function and solving for the price. For example, if the demand function is Qd = 40 - 3P and the supply function is Qs = -5 + 2P, you solve for P by setting Qd equal to Qs.
What does a shift in the supply curve indicate?
-A shift in the supply curve indicates a change in the amount of a good that producers are willing to sell at every price level. This could be due to factors like changes in production costs or technology.
What does a shift in the demand curve indicate?
-A shift in the demand curve indicates a change in consumer preferences or purchasing power. Factors like income changes, population growth, or changes in consumer tastes can shift the demand curve.
How does one calculate the equilibrium quantity after determining the equilibrium price?
-To calculate the equilibrium quantity, substitute the equilibrium price into either the demand or supply function. For example, if the equilibrium price is 9, substitute P = 9 into the demand function Qd = 40 - 3P to find the equilibrium quantity.
Outlines

This section is available to paid users only. Please upgrade to access this part.
Upgrade NowMindmap

This section is available to paid users only. Please upgrade to access this part.
Upgrade NowKeywords

This section is available to paid users only. Please upgrade to access this part.
Upgrade NowHighlights

This section is available to paid users only. Please upgrade to access this part.
Upgrade NowTranscripts

This section is available to paid users only. Please upgrade to access this part.
Upgrade NowBrowse More Related Video


5.0 / 5 (0 votes)