Visualisasi Geolistrik 3 D - PART #1
Summary
TLDRThis video tutorial explains how to create a 3D model based on 2D geoelectric data. It covers the process of using three software tools—Res2DInv, Excel, and Rockwork. The tutorial demonstrates reading and inverting geoelectric data for four lines (L3, L4, L5, and L6), saving the inversion results, and exporting them in Surfer format. The data is then formatted in Excel and prepared for processing in Rockwork. The goal is to help users visualize 3D geoelectric models from 2D data, using freely downloadable software tools for the analysis.
Takeaways
- 😀 This tutorial focuses on building a 3-D model based on 2-D geoelectric data.
- 😀 The process involves using three software programs: Res2DInv, Excel, and Rockwork.
- 😀 The geoelectric data is presented as a vertical section (2D) and a corresponding 3-D model.
- 😀 Four geoelectric data sets are used (L3, L4, L5, L6), with a 50-meter distance between lines.
- 😀 The Res2DInv software is used to read data files and perform inversion for each data set.
- 😀 After performing inversion, the results are displayed and saved as images.
- 😀 The inversion results are exported in Surfer format for further processing.
- 😀 The data is then opened in Excel, and the format includes X, Y, Z coordinates, resistivity, conductivity, and line numbers.
- 😀 The data is combined into one unified format in Excel for consistency.
- 😀 Finally, the prepared data is ready to be processed using Rockwork software for 3-D modeling.
Q & A
What is the main focus of this video?
-The video focuses on how to build a 3D model based on 2D geoelectric data, using three software tools: Res2DInv, Excel, and Rockwork.
What is the significance of the left and right sides in the video?
-The left side shows a vertical section of the 2D geoelectric data, while the right side illustrates the 3D model created based on that data.
What software tools are used in this process?
-The process uses Res2DInv, Excel, and Rockwork, all of which can be freely downloaded.
How many geoelectric data lines are used in the example, and what are their names?
-The example uses four geoelectric data lines: L3, L4, L5, and L6.
What is the distance between the data lines in the example?
-The distance between the data lines is 50 meters.
What is the first step in the process using Res2DInv?
-The first step is to read the data file into Res2DInv.
What happens after reading the data file in Res2DInv?
-After reading the data file, the next step is to carry out the inversion, and this process is repeated for each data line (L4 to L6).
What is the next step after the inversion process in Res2DInv?
-After inversion, the results are displayed, saved as a picture, and then the model is exported in Surfer format.
What should be done with the data once it is exported from Res2DInv?
-The data is then opened in Excel, where it is formatted to include X, Y, Z coordinates, resistivity, conductivity, and line positions based on the geoelectric line map.
What is the final step mentioned in the video for processing the data?
-The final step mentioned is combining all the data into one format and preparing it to be processed using Rockwork.
Outlines

This section is available to paid users only. Please upgrade to access this part.
Upgrade NowMindmap

This section is available to paid users only. Please upgrade to access this part.
Upgrade NowKeywords

This section is available to paid users only. Please upgrade to access this part.
Upgrade NowHighlights

This section is available to paid users only. Please upgrade to access this part.
Upgrade NowTranscripts

This section is available to paid users only. Please upgrade to access this part.
Upgrade NowBrowse More Related Video
Autocad 2dimensional to 3dimensional beginner # 42 mechanical engineering
SolidWorks - Tutorial for Beginners in 13 MINUTES! [ COMPLETE ]

tNavigator 8: 2D and 3D Map
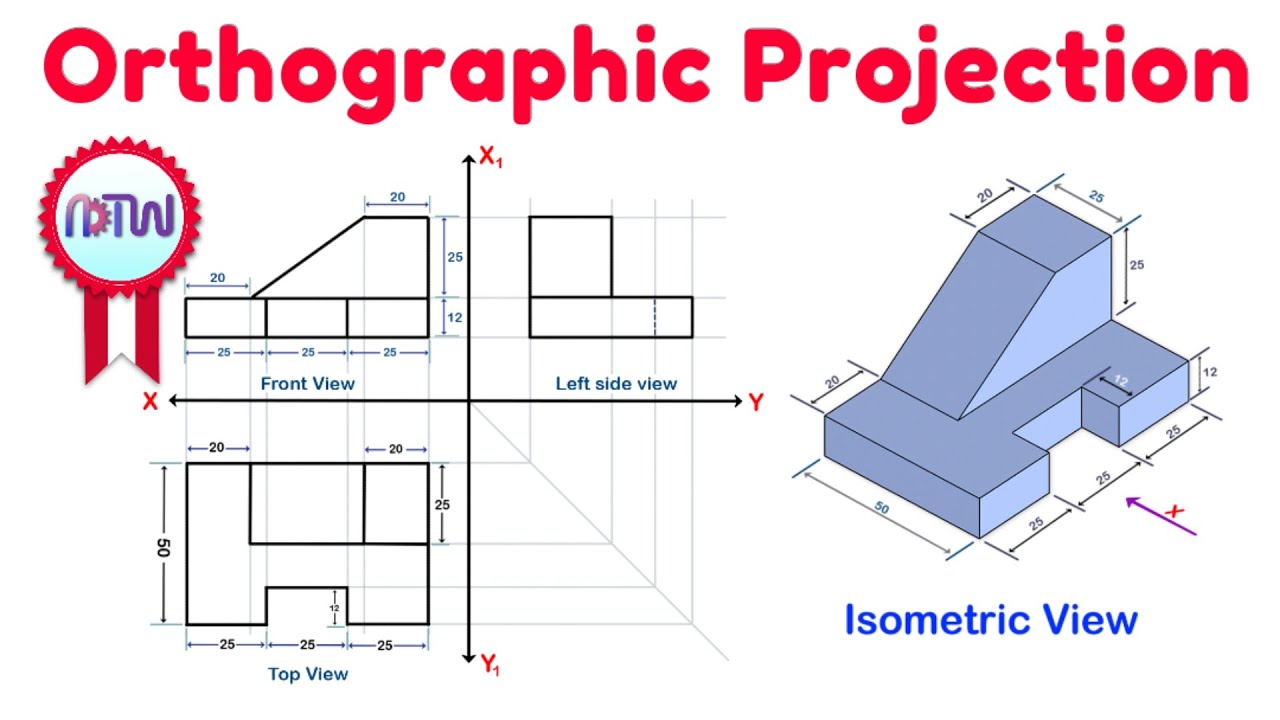
Orthographic Projection from isometric view in Engineering drawing
Fusion 360 Tutorial : Membuat Gambar kerja - Untuk pemula
Cara membuat Diagram Batang, Diagram Lingkaran, dan Diagram Garis
5.0 / 5 (0 votes)