一夜。統計學:SPSS介紹&問卷編碼
Summary
TLDRThe video script offers a comprehensive introduction to SPSS, a statistical software package. It highlights the software's interface, which resembles Excel but is tailored for statistical analysis through drag-and-drop and click methods. The tutorial covers key features, such as Data View for entering survey responses and Variable View for coding and defining variables. The script guides viewers on how to input demographic data and Likert scale responses, emphasizing the importance of accurate data entry for reliable statistical analysis. It also touches on the manual effort required for data entry and the provided teaching materials to facilitate the learning process.
Takeaways
- 💻 The video introduces an interface for the statistical software SPSS, which is similar to Excel but designed for more powerful statistical analysis.
- 🔍 SPSS uses a drag-and-click method to assist users in performing statistical analysis, making it user-friendly for those familiar with Excel.
- 📊 The SPSS interface has two main views: 'Data view' for entering and analyzing survey responses, and 'Variable view' for coding and defining variables.
- 📝 In 'Variable view', researchers can define what each code represents, such as assigning '1' for males and '2' for females, to facilitate analysis.
- 🔢 For questions with a continuous scale, like a 5-point Likert scale for agreement, SPSS requires defining each numerical value to represent its corresponding sentiment.
- 📋 The script demonstrates how to manually enter data into SPSS, emphasizing the importance of accuracy to ensure correct statistical calculations.
- 🔖 The process of entering data into SPSS is labor-intensive and requires patience, as errors can lead to incorrect analysis results.
- 📚 The video script includes an example of a questionnaire with demographic and Likert scale questions, showing how they would be coded in SPSS.
- 🔄 The script mentions the efficiency of copying and pasting in SPSS for coding questions with the same scale, to save time and effort.
- 👨🏫 The video is educational, providing a step-by-step guide for students on how to use SPSS for data entry and analysis, with a focus on accuracy and patience.
Q & A
What is the main purpose of the video?
-The main purpose of the video is to introduce the interface of the statistical software SPSS and explain how to use it for data analysis.
How is the SPSS interface similar to Excel?
-The SPSS interface is similar to Excel in that it has a spreadsheet-like appearance with cells where data can be entered and manipulated.
What are the two main views in SPSS that the video discusses?
-The two main views in SPSS discussed in the video are Data View and Variable View.
What is the purpose of Data View in SPSS?
-Data View in SPSS is used for entering and analyzing data for each subject, such as responses to a questionnaire.
What is Variable View used for in SPSS?
-Variable View in SPSS is used for coding the questionnaire items, assigning numerical values to different responses, and providing identification for the researcher.
Why is it necessary to code questionnaire items in SPSS?
-Coding questionnaire items in SPSS is necessary to convert text content into numerical data that the software can analyze, making it easier to perform statistical analysis.
How does the video demonstrate the coding process for questionnaire items?
-The video demonstrates the coding process by showing how to enter variable names, assign numerical values to responses, and use the Numerical Annotation feature to define what each number represents.
What is an example of a demographic variable that might be coded in SPSS?
-An example of a demographic variable coded in SPSS is gender, where 1 might represent male and 2 might represent female.
How does SPSS handle continuous scale questions like those found in a corporate reputation survey?
-For continuous scale questions, such as those in a corporate reputation survey, SPSS allows the user to assign numerical values from 1 to 5, representing different levels of agreement, and then define what each number means.
What is the advantage of using copy and paste in SPSS when coding questionnaire items?
-Using copy and paste in SPSS when coding questionnaire items saves time and effort, especially when the scale or coding system is the same across multiple questions.
Why is it important to be careful when keying in data in SPSS?
-It is important to be careful when keying in data in SPSS because any errors made during this process can lead to incorrect calculations and analysis results.
How does the video suggest organizing the data entry process in SPSS?
-The video suggests organizing the data entry process by keying in data from left to right for each questionnaire, ensuring a consistent and orderly approach to data entry.
What does the video imply about the relationship between the effort put into data entry and the quality of statistical analysis?
-The video implies that the effort put into accurate data entry is directly related to the quality of the statistical analysis, as errors in data entry can compromise the validity of the results.
Outlines

This section is available to paid users only. Please upgrade to access this part.
Upgrade NowMindmap

This section is available to paid users only. Please upgrade to access this part.
Upgrade NowKeywords

This section is available to paid users only. Please upgrade to access this part.
Upgrade NowHighlights

This section is available to paid users only. Please upgrade to access this part.
Upgrade NowTranscripts

This section is available to paid users only. Please upgrade to access this part.
Upgrade NowBrowse More Related Video
Introduction to JASP: Discover Statistics with JASP for Beginners (1 of 6)
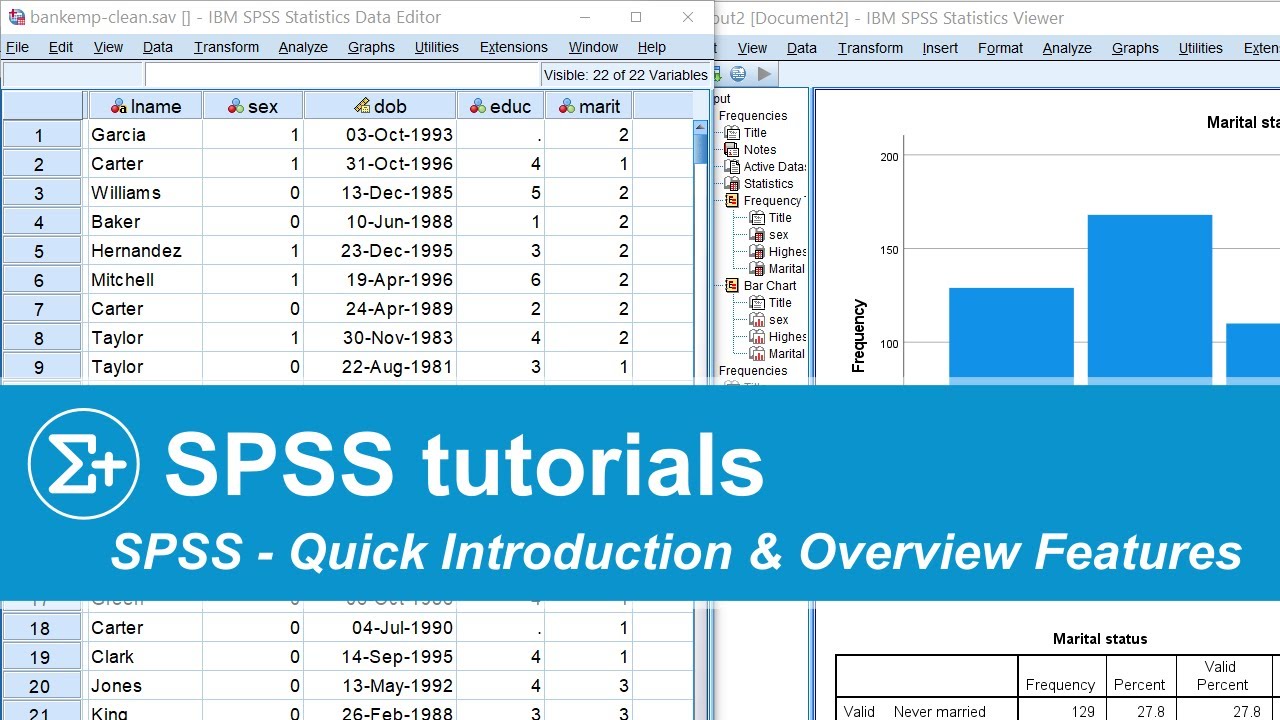
SPSS - Quick Introduction & Overview Main Features
SPSS tutorial in tamil for beginners part -1 | Introduction

Berkenalan dengan Jamovi

Introduction to the SPSS 27 Workspace for Beginners (with Puppies) (2 of 8)

‼️PENGENALAN SPSS | JENIS DATA & CONTOH KASUS DASAR - Part2
5.0 / 5 (0 votes)