DESCRIBING GRAPHS IN ENGLISH 📊 | Great for IELTS, TOEFL, or Business Presentations
Summary
TLDRThis video teaches how to describe trends in graphs using specific vocabulary in English. It covers terms for increasing, decreasing, fluctuating, and stable trends, such as 'rise,' 'soar,' 'decline,' and 'zigzag.' The speaker emphasizes the importance of using varied and precise language to describe data accurately, rather than relying on vague terms. The lesson encourages learners to practice using these words and adverbs like 'gradually' and 'significantly' to become more specific. Ultimately, it's about mastering graph descriptions for clearer communication in real-life contexts, from politics to economics.
Takeaways
- 😀 Describing graphs in English is important, especially for learners, as it helps communicate trends in data clearly.
- 😀 Graphs are a common way to visualize data, found in various places such as schools, workplaces, and newspapers.
- 😀 It's essential to use precise vocabulary when describing trends in graphs, rather than just saying 'the numbers are going up' or 'the numbers are going down'.
- 😀 When describing upward trends, you can use words like 'rise', 'increase', 'soared', or 'soaring', depending on the speed and magnitude of the change.
- 😀 For downward trends, words like 'decreased', 'decline', 'drop', 'fall', and 'plummeted' can be used to show varying degrees of change.
- 😀 Fluctuating data, where numbers go up and down, can be described with terms like 'fluctuated' or 'zigzag', with 'zigzag' indicating larger, more dramatic changes.
- 😀 When the numbers remain constant, terms like 'remain constant', 'stay the same', 'leveled off', or 'stabilized' are used.
- 😀 The word 'stabilized' is particularly used when there was fluctuation earlier, but the numbers eventually evened out.
- 😀 Adverbs like 'gradually', 'dramatically', 'steadily', or 'significantly' can be paired with verbs to provide a more specific description of trends in graphs.
- 😀 It's important not to rely on using the same words repeatedly, so expanding your vocabulary helps in providing more nuanced descriptions of graph data.
Q & A
Why is it important to know how to describe graphs in English?
-It is important because graphs and data analysis are used to discuss various aspects of life, such as finances, politics, and social trends. Knowing how to describe them helps in communicating complex information more clearly and accurately.
What are the different terms used to describe data trends that are increasing?
-Some terms used to describe increasing data trends include 'rise,' 'increase,' and 'soar/soaring.' Each of these words implies a different level of intensity, with 'soar' indicating a rapid and significant increase.
What is the difference between 'decline' and 'decrease'?
-'Decline' refers to a gradual, steady decrease over time, while 'decrease' is a more general term that can describe any reduction in data, whether gradual or sudden.
When should the word 'plummet' be used in describing a graph?
-'Plummet' is used when there is a sudden and drastic decrease in the data. It describes a sharp drop that happens quickly and significantly, e.g., 'The company's stock plummeted after the CEO resigned.'
What does it mean when data 'fluctuates'?
-When data fluctuates, it means the values go up and down, but not necessarily in large amounts. The trend can vary slightly or more significantly, but the key point is the back-and-forth movement.
How does 'zigzag' differ from 'fluctuate' when describing data?
-'Zigzag' refers to a pattern of sharp and dramatic fluctuations, where the high and low points are significantly different. 'Fluctuate' can describe smaller or less dramatic changes in data.
What is the significance of using adverbs like 'gradually' or 'dramatically' when describing data trends?
-Adverbs like 'gradually,' 'dramatically,' and 'significantly' add specificity and detail to the description, helping to convey how the trend develops over time. They make the description of the trend more accurate and vivid.
What does it mean when data 'stabilizes'?
-When data 'stabilizes,' it means that the data, after fluctuating or changing, becomes steady and constant. This term is typically used when a trend that was previously unstable becomes more predictable or uniform.
Can 'decreased' be used for both gradual and sudden changes in data?
-Yes, 'decreased' is a general term and can be used for both gradual and sudden decreases. However, for more specific or dramatic changes, words like 'drop,' 'fall,' or 'plummet' are often more appropriate.
What is the purpose of using different words to describe trends in data?
-Using different words helps avoid repetition and allows for a more precise and clear description of the trend. It provides a way to express the intensity, speed, or pattern of the data movement, making the description more accurate and varied.
Outlines

This section is available to paid users only. Please upgrade to access this part.
Upgrade NowMindmap

This section is available to paid users only. Please upgrade to access this part.
Upgrade NowKeywords

This section is available to paid users only. Please upgrade to access this part.
Upgrade NowHighlights

This section is available to paid users only. Please upgrade to access this part.
Upgrade NowTranscripts

This section is available to paid users only. Please upgrade to access this part.
Upgrade NowBrowse More Related Video
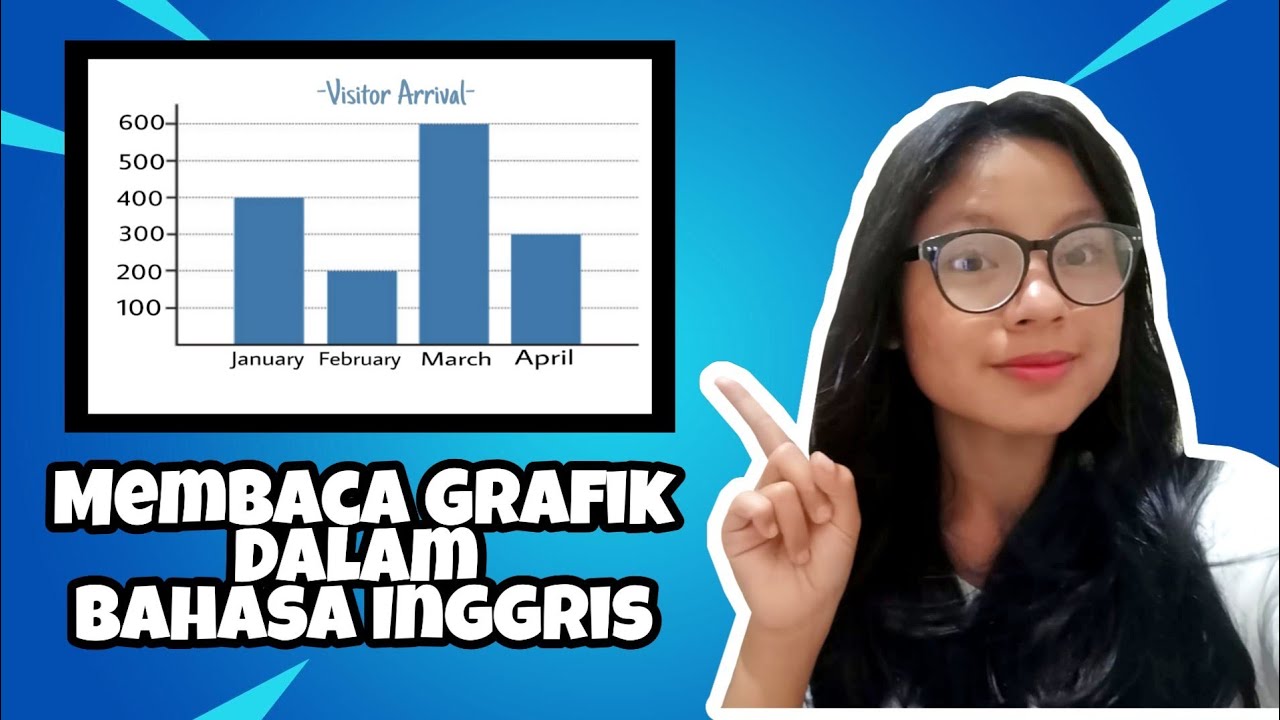
Membaca Grafik Dalam Bahasa Inggris || Eni Kesuma

How to talk about charts and graphs in English (advanced English lessons)
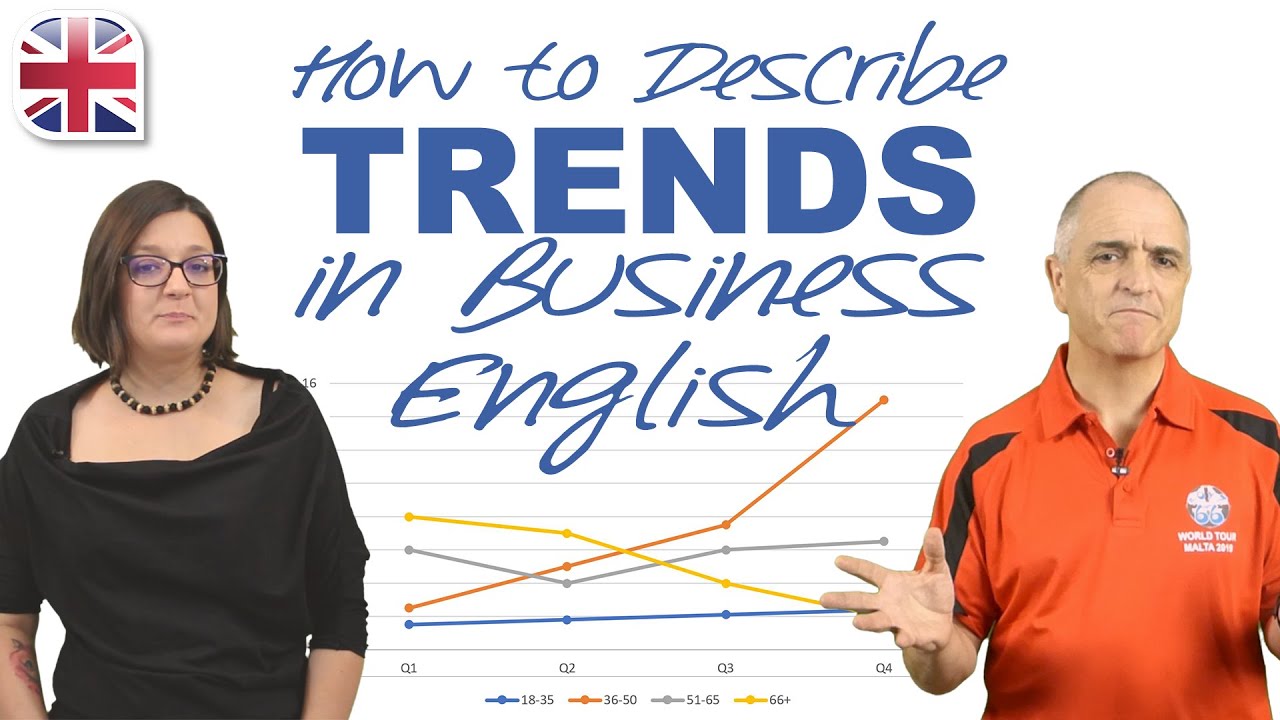
Describe Trends in Business English - Describing Statistics, Sales and Market Trends

Talking About Your Vacation in English - Spoken English Lesson

15 English personality adjectives| How to ask and talk about someone's personality?

Describing People in English (How to Describe PHYSICAL APPEARANCE in English)
5.0 / 5 (0 votes)