Data Processing Material (Mean, mode, median
Summary
TLDRThis educational video introduces data processing concepts, focusing on three key topics: mean, mode, and median. The mean is the average value, calculated by dividing the sum of all values by the total number of data points. The mode is the value that appears most frequently, and the median is the middle value when the data is sorted. The video provides clear examples using student quiz scores and weight data to demonstrate these concepts. The lesson is designed to help viewers understand how to calculate and interpret mean, mode, and median in data sets.
Takeaways
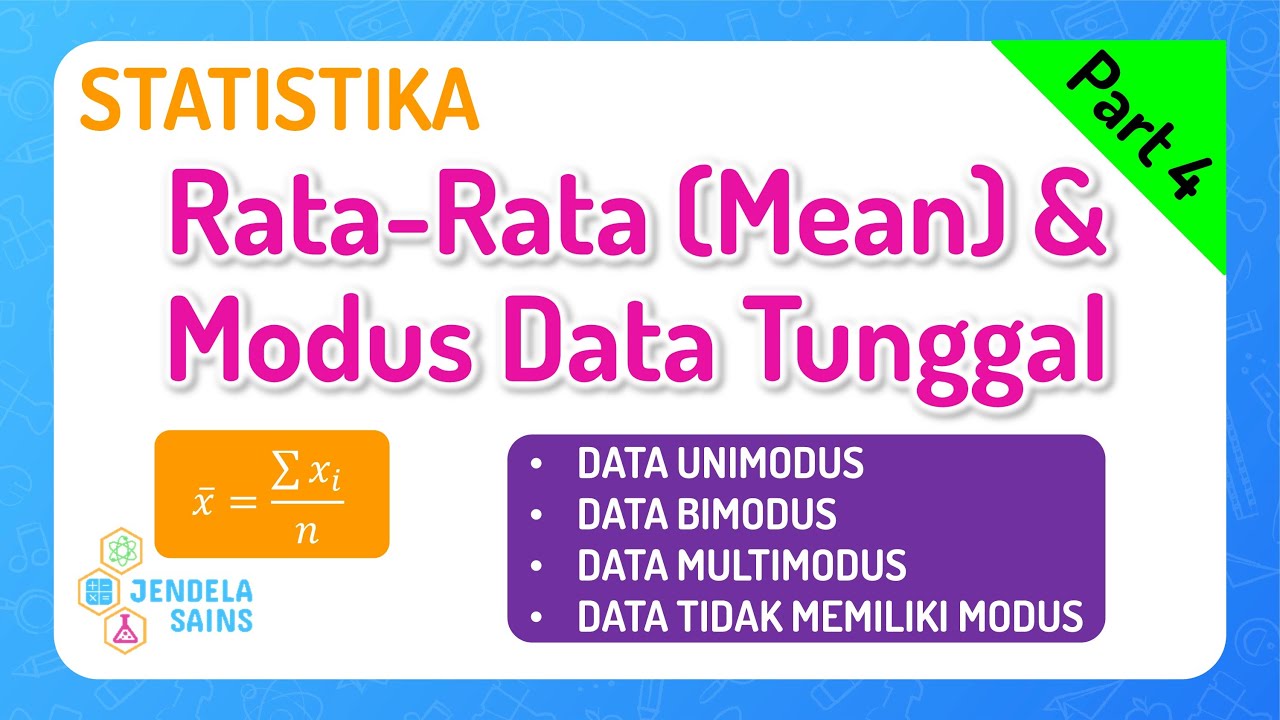
- 😀 The **mean** is the average value of a data set, calculated by adding all values and dividing by the number of data points.
- 😀 The **mode** is the value that appears most frequently in a data set, representing the highest frequency.
- 😀 The **median** is the middle value in a sorted data set. If the data set has an odd number of values, it is the middle one; if even, it's the average of the two middle values.
- 😀 To calculate the **mean**, you multiply each data value by its frequency, sum the results, and divide by the total number of data points.
- 😀 An example of calculating the **mean** involves adding the weighted values (score times frequency) and dividing the sum by the total number of data entries.
- 😀 The **mode** can be identified by looking for the value with the highest frequency in a dataset. In the quiz score example, the mode is 7.
- 😀 When finding the **median**, always sort the data in ascending order first. The median is the middle value of the sorted data.
- 😀 If the data set has an even number of elements, the **median** is the average of the two middle values.
- 😀 In the weight data example, after sorting, the median was found to be 33, as it was the middle value in the sorted list of 15 entries.
- 😀 Understanding **data processing** helps to summarize and understand large datasets using key measures like the mean, mode, and median.
Q & A
What is the main concept being taught in the video?
-The video teaches data processing, specifically focusing on the concepts of Min (Mean), Mode, and Median.
How do you calculate the Min (Mean) value from a set of data?
-To calculate the Min (Mean), you add up all the values, then divide the sum by the total number of data points.
In the provided example, what is the Min (Mean) score for the grade 6 quiz?
-The Min (Mean) score for the grade 6 quiz is 6.64.
What is the definition of Mode in data processing?
-The Mode is the value that appears most frequently in a dataset.
In the quiz score example, what is the Mode of the data?
-The Mode of the quiz scores is 7, as it appears the most frequently (7 times).
What is the definition of Median in data processing?
-The Median is the middle value in a dataset when the values are sorted in ascending order.
How do you calculate the Median when the number of data points is even?
-When the number of data points is even, you find the two middle values, then add them together and divide by two to get the Median.
What is the Median of the weight data for grade 6 students at Sukamaju Elementary School?
-The Median of the weight data is 33, as the two middle values were 33 and 33, and their sum divided by two gives 33.
What are the steps to find the Mean from the grade 6 quiz scores?
-First, multiply each score by its frequency. Then, sum all the results and divide the total by the number of data points.
Why is it important to sort the data when calculating the Median?
-Sorting the data ensures that you can accurately identify the middle value, which is crucial for finding the correct Median.
Outlines

This section is available to paid users only. Please upgrade to access this part.
Upgrade NowMindmap

This section is available to paid users only. Please upgrade to access this part.
Upgrade NowKeywords

This section is available to paid users only. Please upgrade to access this part.
Upgrade NowHighlights

This section is available to paid users only. Please upgrade to access this part.
Upgrade NowTranscripts

This section is available to paid users only. Please upgrade to access this part.
Upgrade NowBrowse More Related Video

Statistika Dasar Ukuran Pemusatan Data (Mean, Modus, Median) Data Tunggal dan Data Kelompok
Statistika • Part 4: Ukuran Pemusatan Data Tunggal - Rata-Rata (Mean) dan Modus
Ukuran Pemusatan Data Kelompok

STATISTIKA CARA MENCARI NILAI MEAN, MEDIAN, MODUS DATA KELOMPOK PART 1

Statistika 1 ~ Ukuran Pemusatan Data (Mean/Rata-Rata, Median, Modus) ~ Materi PJJ Kelas VIII / 8 SMP

Statistics: The average | Descriptive statistics | Probability and Statistics | Khan Academy
5.0 / 5 (0 votes)