TUTORIAL MEMBUAT PETA KEMIRINGAN LERENG | ARCGIS
Summary
TLDRThis tutorial walks viewers through the process of creating a slope map using GIS tools for land rehabilitation and soil conservation. The video covers data setup, slope calculation, reclassification, and conversion from raster to polygon formats. Viewers learn how to eliminate unwanted small polygons, merge them, and assign appropriate attributes. The tutorial also includes steps to assign colors to different slope classes for better visualization. By the end, viewers will have a comprehensive, classified slope map tailored to rehabilitation guidelines.
Takeaways
- 😀 The video tutorial is about creating a slope map using DEM data.
- 😀 The tutorial follows the guidelines for land rehabilitation and soil conservation planning.
- 😀 To create a slope map, the user needs to first use the 'Raster Surface' tool and select 'Slope'.
- 😀 DEM data from Alas Pasar 6 is used as the base data for creating the slope map.
- 😀 The 'Reclassify' tool is used to classify the slope map into 5 classes based on the guidelines.
- 😀 The slope map is classified by percentage rise, which is crucial for land rehabilitation purposes.
- 😀 After classification, smaller polygons are eliminated using the 'Eliminate' tool to simplify the map.
- 😀 Polygons are converted from raster to vector format for easier editing and processing.
- 😀 The process includes setting an area threshold (e.g., 300,000 or 400,000) to eliminate unwanted small polygons.
- 😀 Once the slope map is finalized, attributes like class, description, and area are added for better visualization and analysis.
- 😀 The final output is a slope map that is ready for use in land rehabilitation planning and soil conservation efforts.
Q & A
What is the main topic of the tutorial in the video?
-The main topic of the tutorial is how to create a slope map (peta kelerengan) using DEM (Digital Elevation Model) data, following the guidelines for land rehabilitation and soil conservation.
What software tools are mentioned for creating the slope map?
-The tutorial mentions the use of Tridea Analysis Tool and Raster Surface tools to create the slope map. Specifically, the 'Slope' and 'Reclassify' tools are used.
How is the DEM data used in the creation of the slope map?
-The DEM data is used as the base material for creating the slope map. It is input into the tools to calculate slope percentage and categorize different slope classes.
What are the five slope classes that are created based on the guidelines?
-The five slope classes are based on specific guidelines for land rehabilitation and soil conservation. The exact classes are not explicitly detailed in the transcript, but they are grouped into ranges of slope percentages, typically classified into low, moderate, and high slope categories.
Why is raster data converted into polygons during the process?
-Raster data is converted into polygons to facilitate further processing, such as elimination of unwanted areas and creating larger, meaningful zones based on specific slope classes.
What is the purpose of the elimination process in the tutorial?
-The elimination process is used to remove smaller polygons or areas that are not of interest, consolidating them into larger, more relevant zones for better classification and analysis.
How are the attributes added to the slope map in the final steps?
-Attributes such as the slope class, description, and area size are added to the slope map in the final steps. This is done by opening the attribute table and entering the relevant data.
What role do colors play in the final slope map?
-Colors are used to differentiate the various slope classes on the map. This helps to visually distinguish between different levels of slope, making the map more intuitive to interpret.
What is the significance of using a percentage rise when creating the slope map?
-The percentage rise is used to define the slope's steepness. It is an essential parameter in the classification of slopes, helping to categorize them into different classes based on predefined thresholds.
How does the tutorial ensure that the slope map is accurate and follows the guidelines?
-The tutorial ensures accuracy by following specific guidelines for land rehabilitation and soil conservation, and by carefully reclassifying the data into five classes based on these guidelines. The steps include filtering and eliminating unwanted data, ensuring the final map is in line with the recommended practices.
Outlines

This section is available to paid users only. Please upgrade to access this part.
Upgrade NowMindmap

This section is available to paid users only. Please upgrade to access this part.
Upgrade NowKeywords

This section is available to paid users only. Please upgrade to access this part.
Upgrade NowHighlights

This section is available to paid users only. Please upgrade to access this part.
Upgrade NowTranscripts

This section is available to paid users only. Please upgrade to access this part.
Upgrade NowBrowse More Related Video
Tutorial Membuat Peta Erosi Secara Spasial Menggunakan Arcgis dengan rumus USLE

Praktikum Sistem Informasi Geografi - Pembuatan Peta Kemiringan Lereng Demnas
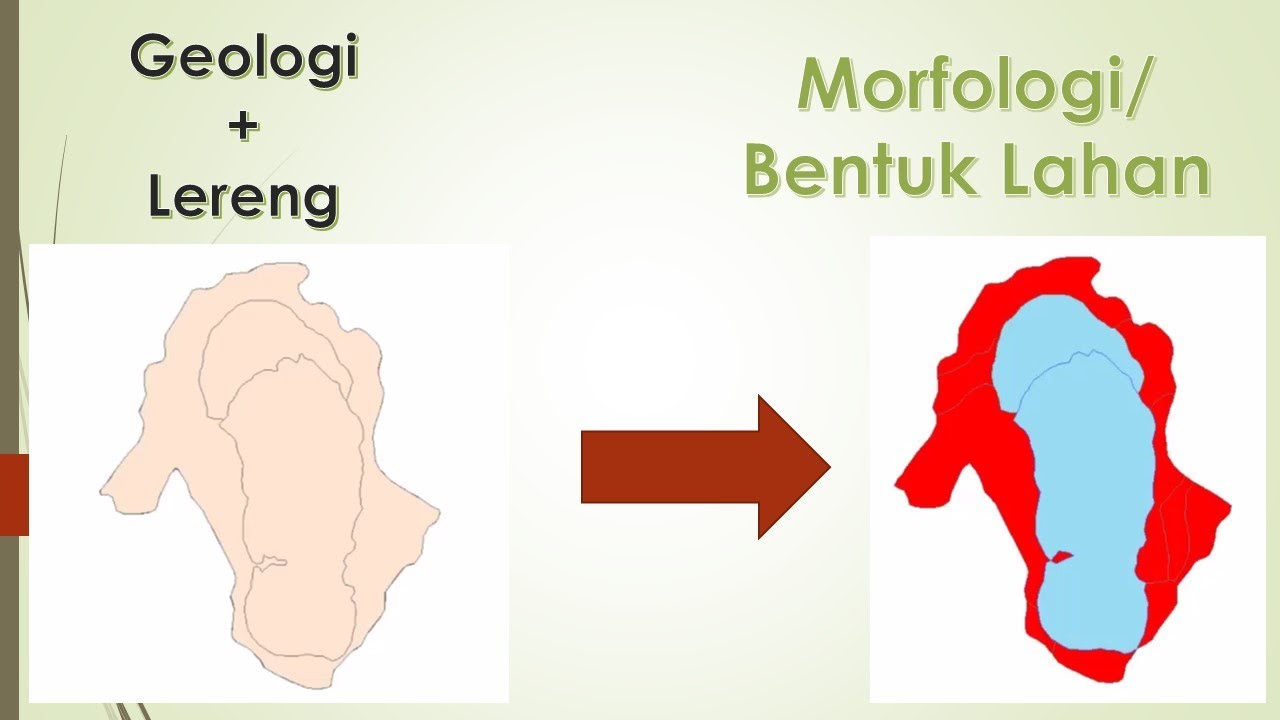
Peta Morfologi menggunakan ArcGis
How to Prepare Slope Map from DEM #shorts #youtubeshorts #gis

Digitasi Peta Melalui Arcview 3.3

Slope Analysis using ArcGIS Pro | With DEM Data
5.0 / 5 (0 votes)