Statistika • Part 17: Cara Membuat Tabel Distribusi Frekuensi
Summary
TLDRIn this video, the process of creating a frequency distribution table is explained step by step using the math test scores of 20 students. The video covers four key stages: determining the range, calculating the number of classes, determining the class interval, and constructing the frequency table. Through an example, the method for organizing raw data into grouped data is demonstrated, with a clear breakdown of the calculations involved. This tutorial is helpful for understanding data classification and the creation of frequency distribution tables in statistics.
Takeaways
- 😀 The video focuses on how to create a frequency distribution table for grouped data in statistics.
- 😀 The process of creating a frequency distribution table involves four main steps: determining the range, number of classes, interval length, and constructing the table itself.
- 😀 The first step in creating a frequency distribution table is calculating the range, which is the difference between the largest and smallest data points.
- 😀 The second step is determining the number of classes, which can be calculated using the formula k = 1 + 3.3 * log(n), where n is the number of data points.
- 😀 For 20 data points, the number of classes is rounded to 5 using the formula.
- 😀 The third step is calculating the class interval length (C), which is the range divided by the number of classes.
- 😀 In this case, the interval length is calculated to be 4.8, which is rounded to 5.
- 😀 The fourth step involves constructing the frequency distribution table, which includes columns for class intervals and corresponding frequencies.
- 😀 When filling out the table, data points are grouped into their respective intervals, and the frequency for each class is counted.
- 😀 The final frequency distribution table for the math test scores includes 5 classes with their respective frequencies: 70-74 (4), 75-79 (7), 80-84 (6), 85-89 (2).
- 😀 The video emphasizes that while constructing the table, data does not need to be sorted, and the frequency distribution table helps summarize and present the data effectively.
Q & A
What is the focus of the video?
-The video focuses on how to create a frequency distribution table for grouped data in statistics, specifically through the steps of classifying and presenting data.
What are the four key stages to creating a frequency distribution table?
-The four key stages are: 1) Determining the range (J), 2) Determining the number of classes (k), 3) Determining the class interval length (C), and 4) Constructing the frequency distribution table.
How is the range (J) calculated?
-The range (J) is calculated by subtracting the smallest data value (X1) from the largest data value (Xn).
How do you calculate the number of classes (k)?
-The number of classes (k) is calculated using the formula k = 1 + 3.3 log(n), where 'n' is the number of data points. For 20 data points, the number of classes comes out to 5 after rounding.
Why is it necessary to round the number of classes (k)?
-The number of classes must be a whole number because a frequency distribution table cannot have a fraction of a class. Therefore, any decimal value needs to be rounded to the nearest whole number.
How is the class interval length (C) determined?
-The class interval length (C) is determined by dividing the range (J) by the number of classes (k). In the example, the range is 24, and the number of classes is 5, resulting in a class interval length of 4.8, which is rounded to 5.
Why must the class interval length (C) be a whole number?
-The class interval length must be a whole number to maintain consistency in grouping the data. A non-whole interval length would create confusion and irregular class boundaries.
What is the purpose of the 'frequency tally' used in the process?
-The 'frequency tally' helps in counting how many data points fall within each class interval. It is a visual aid to keep track of data placement during the grouping process.
How do you organize the class intervals in the frequency distribution table?
-The class intervals are organized with the lower boundary of each class listed first, followed by the upper boundary. For example, a class interval may be 70-74, 75-79, and so on.
What is the final step in constructing the frequency distribution table?
-The final step is to count the frequency of data points that fall within each class interval and then record these frequencies in the table to complete the frequency distribution.
Outlines

This section is available to paid users only. Please upgrade to access this part.
Upgrade NowMindmap

This section is available to paid users only. Please upgrade to access this part.
Upgrade NowKeywords

This section is available to paid users only. Please upgrade to access this part.
Upgrade NowHighlights

This section is available to paid users only. Please upgrade to access this part.
Upgrade NowTranscripts

This section is available to paid users only. Please upgrade to access this part.
Upgrade NowBrowse More Related Video

Statistika (Distribusi Frekuensi Data Tunggal dan Kelompok)
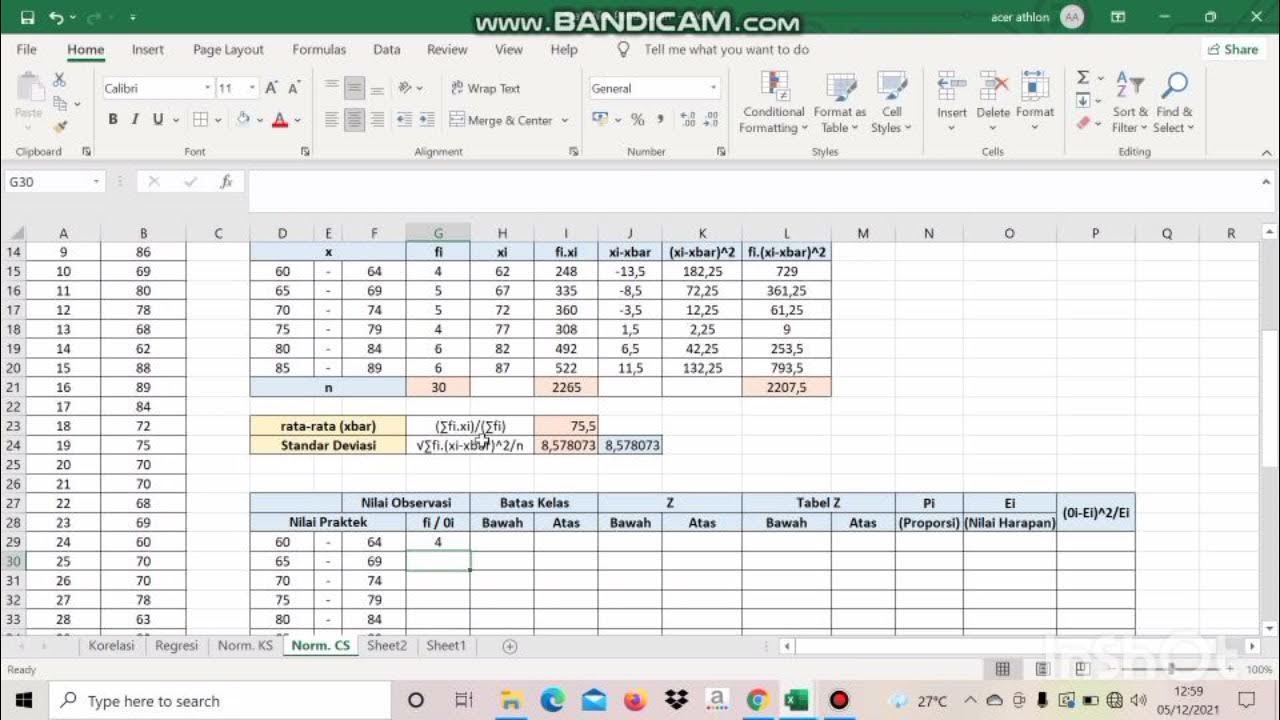
#4 Uji Normalitas Chi Square dengan Excel - Statistika Pendidikan
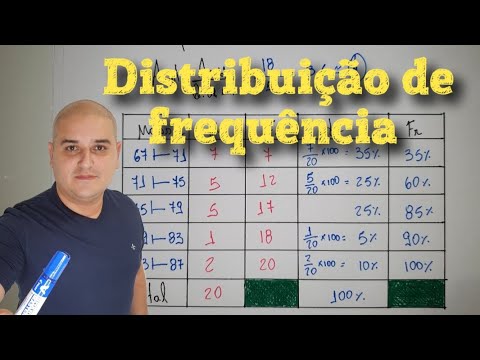
Distribuição de frequência com classes
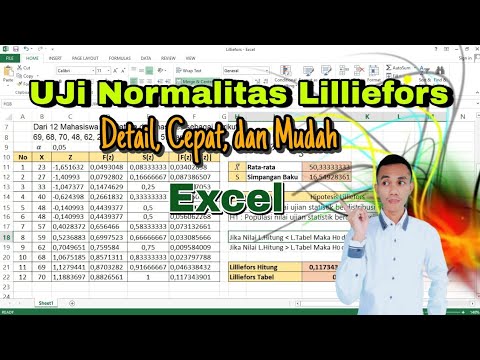
Uji Normalitas Lilliefors | cara cepat uji normalitas lilliefors di Excel | Uji normalitas excel
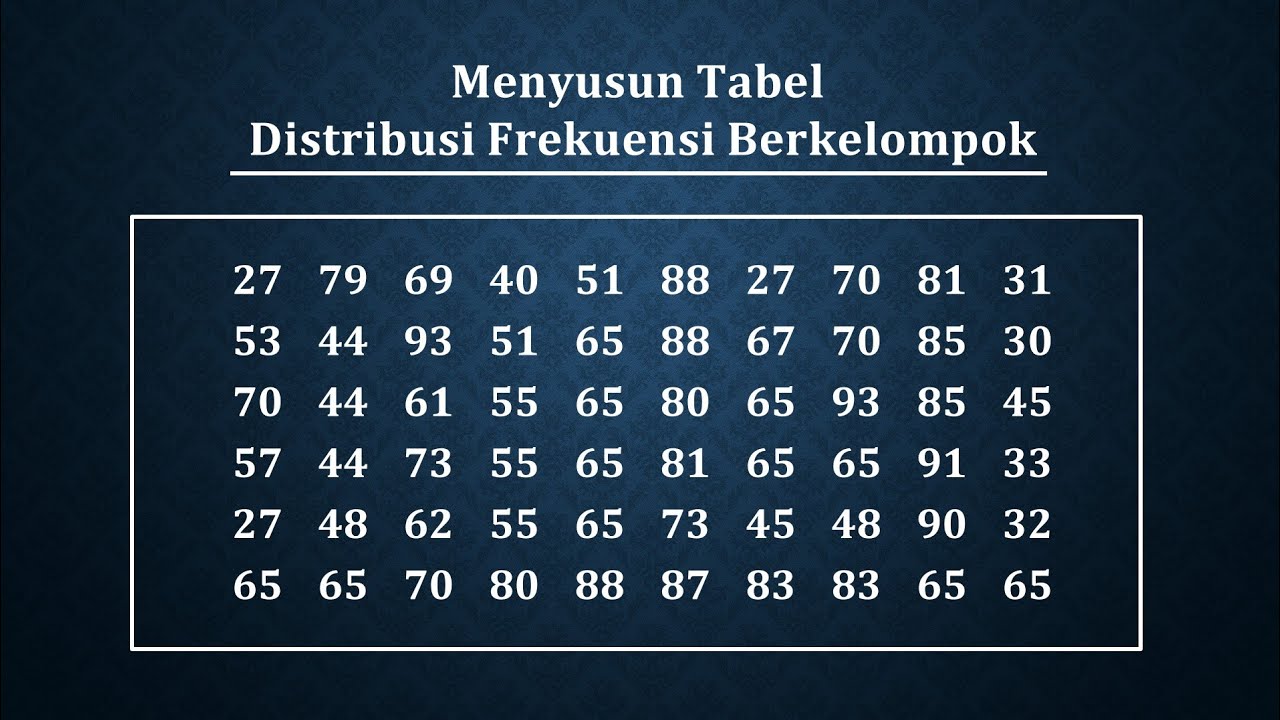
Cara menyusun tabel distribusi frekuensi berkelompok
Cuartiles, Deciles y Percentiles | Datos agrupados en intervalos | Ejemplo 2
5.0 / 5 (0 votes)